

Here's a story about a brand that spent millions of dollars on advertising and watched its website traffic go down. Most marketers would call that a failure. Most marketers would be wrong — and the ad data explains why in about four numbers.
What the AdSee AI YouTube ads library shows about the Swarovski x Ariana Grande campaign
Swarovski ran five YouTube ads featuring Ariana Grande between January 13 and February 26, 2026, collecting roughly 373M views on an estimated $7.4M–$18.4M in media spend, per AdSee AI. Over the same window, monthly visits to swarovski.com fell from about 10M to about 8.5M, according to Similarweb.
Those two facts are supposed to be incompatible. They aren't, and the gap between them is the most useful thing in this case for anyone buying video. Swarovski is a 130-year-old crystal house that sells most of its volume through boutiques and authorized retailers, which means the campaign was never designed to be measured in a browser. Everything below is an attempt to measure it somewhere else.
The six-week blitz: five ads, 373M views, and then nothing
Swarovski compressed its entire Q1 media weight into a six-week window around Valentine's Day, and the publish dates prove it: five creatives between January 13 and February 26, 2026, then zero new brand ads from March through June, per AdSee AI.
This wasn't a campaign that ran out of budget. This was the budget. All of it, detonated around one moment.
The January 13 opener: the Valentine's Collection spot
The campaign opened with a 15-second Valentine's Collection spot — chocolates, heart-shaped pendants, Ariana Grande in red — that gathered 83M views on an estimated $1.6M–$4.1M in spend, per AdSee AI. It ran alone for six weeks, which is unusual: most performance advertisers launch a hero with two or three variants on day one so the auction has something to optimize against.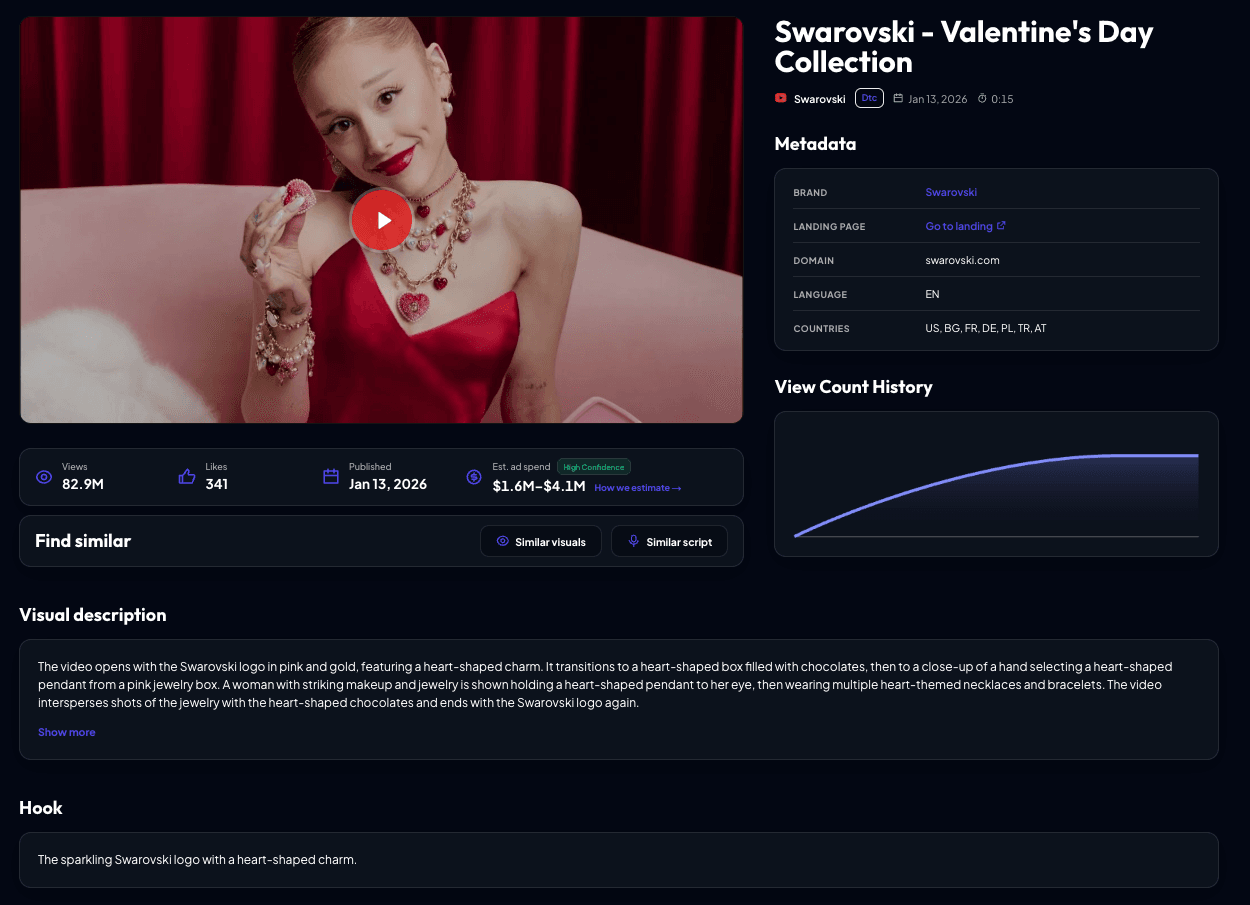
February 26: four Dragonfly ads released in a single day
On February 26, Swarovski released four creatives for the Ariana Grande x Swarovski Dragonfly capsule on the same day, and their combined 289.6M views arrived from a single coordinated buy, per AdSee AI. Ethereal dresses, crystal dragonflies, lotus flowers — one shoot, four cuts.
A 15-second hero collected 114.2M views on an estimated $2.2M–$5.7M, reported at high confidence by AdSee AI.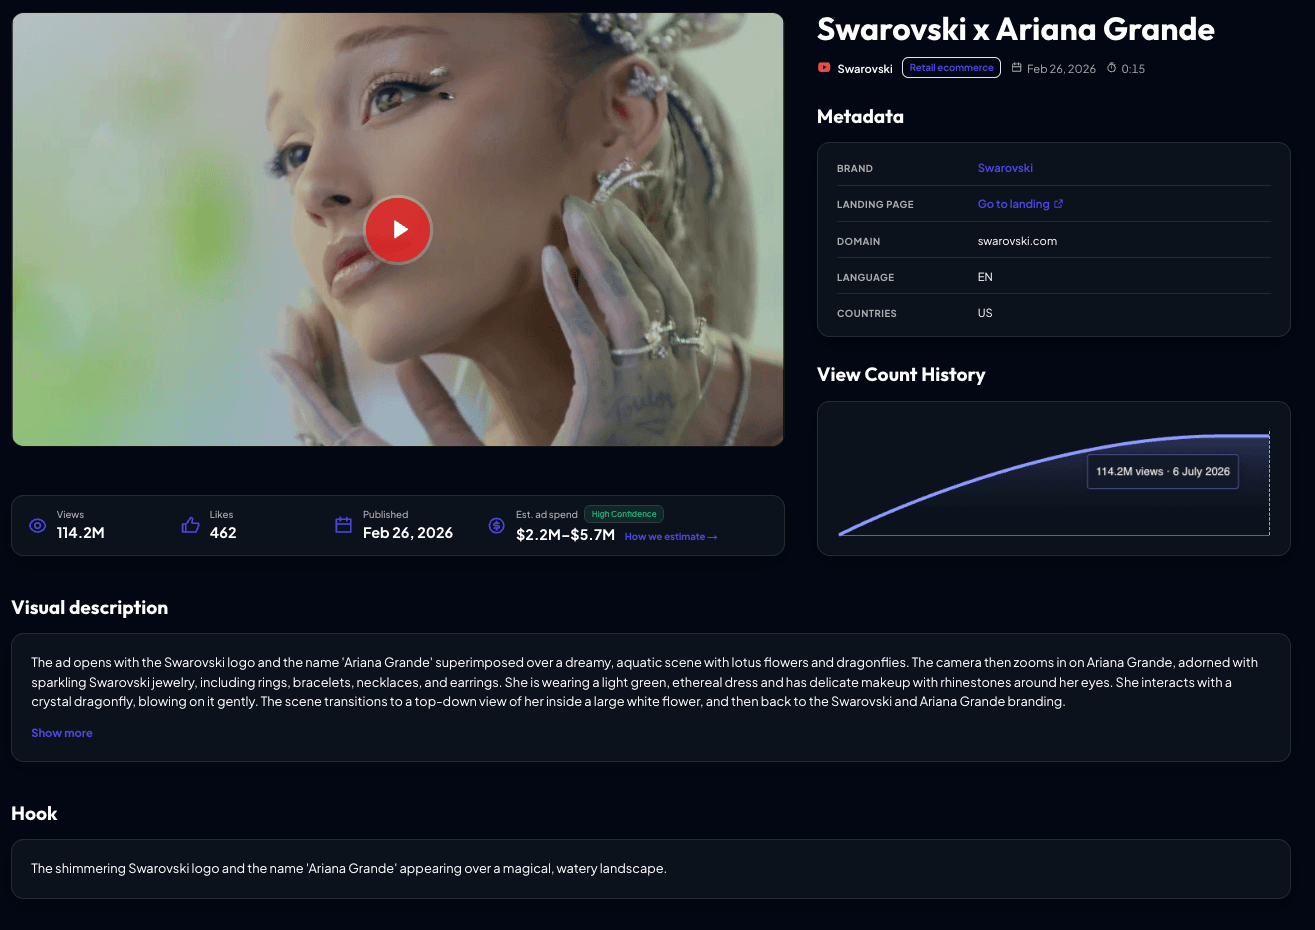
A 6-second cutdown collected 91M views on an estimated $1.8M–$4.5M, per AdSee AI.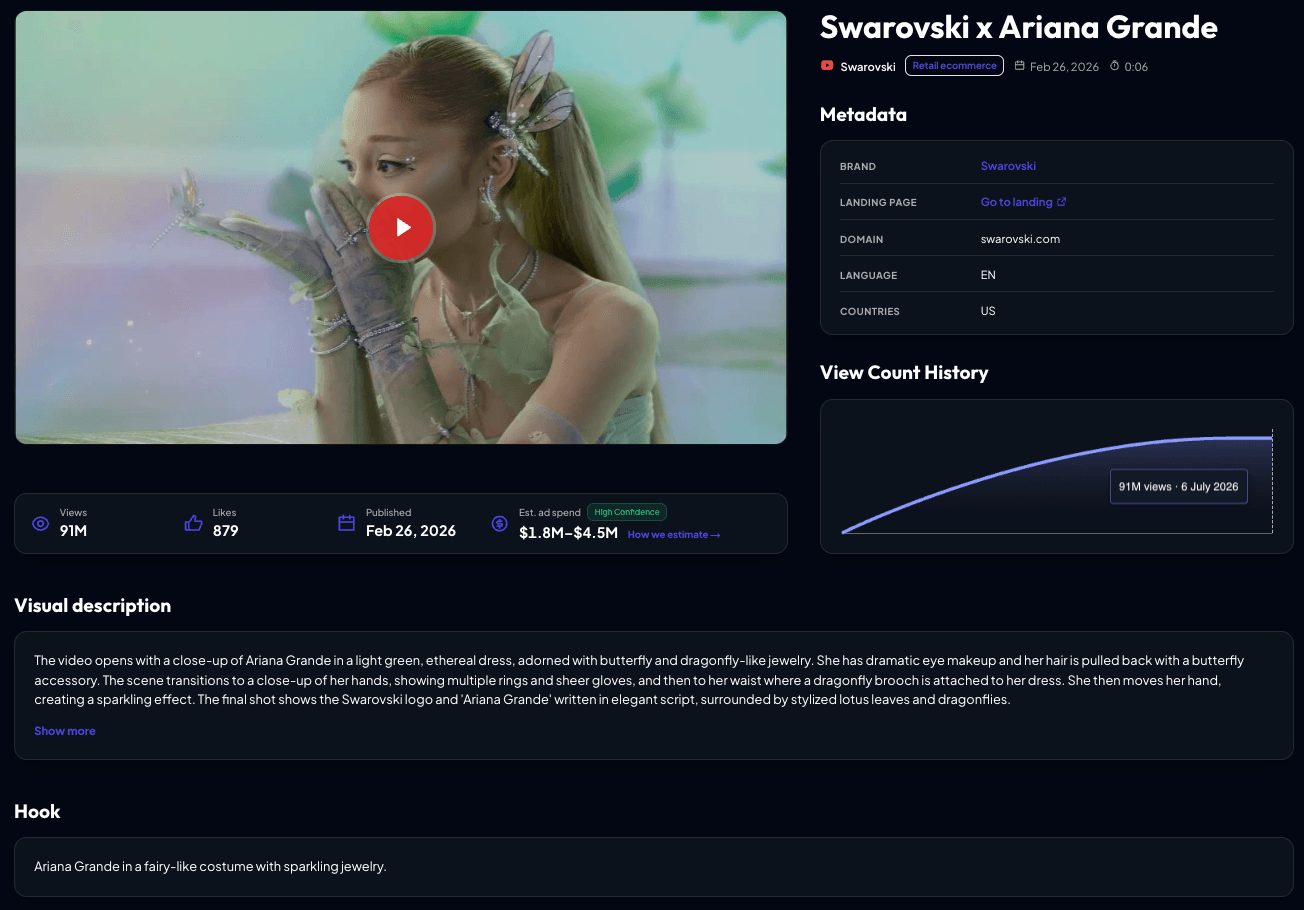
A second 6-second cut collected 46.5M views on an estimated $930K–$2.3M, per AdSee AI.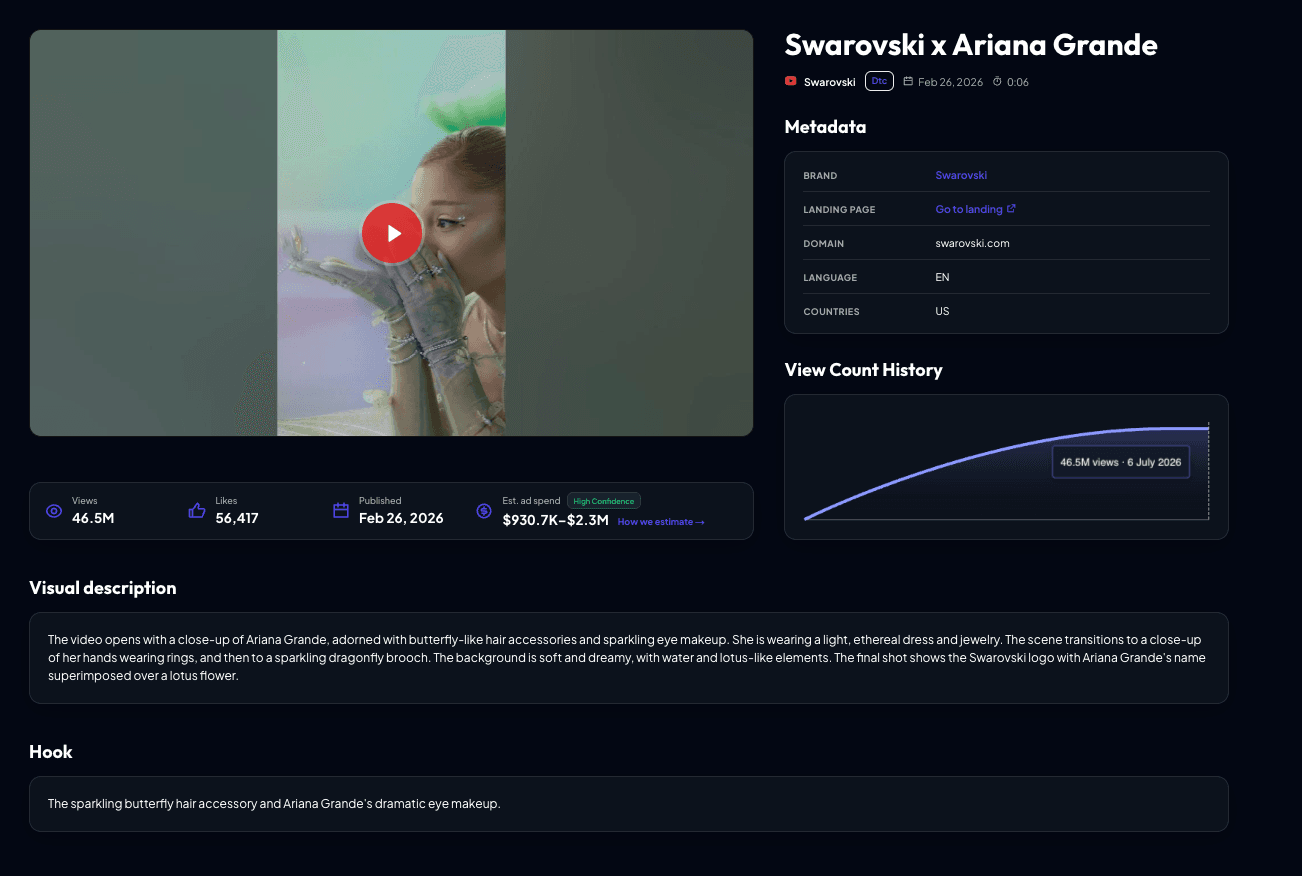
The length ladder inside the Dragonfly fleet
The fleet is built as a two-tier length ladder — two 15-second cuts carrying 152.1M views and two 6-second cuts carrying 137.5M views, per AdSee AI — which is a reach structure, not a testing structure. A test fleet varies the hook, the talent, or the offer. This one varies only duration, which is what you do when the creative decision is already made and the remaining job is buying frequency across formats without fatiguing a single asset.
Luxury doesn't drip. Luxury detonates. A performance brand spreads budget across 52 weeks and optimizes. A luxury house compresses everything into six weeks around a gifting moment, owns that moment, and goes quiet — because scarcity is the product, and scarcity applies to advertising too. You cannot see that structure in a traffic chart. You can only see it in the publish dates.
Why Swarovski published no new YouTube ads from March to June
Swarovski's four-month silence after February 26 is a deliberate feature of the buy, not a data gap, and it is visible as an absence of new creatives in the AdSee AI YouTube ads library through June 2026. Gifting categories don't have a reason to advertise between Valentine's Day and the autumn run-up, and a heritage brand that keeps talking through the quiet months trains its audience to treat the loud months as ordinary.
The silence also has a measurement consequence that most teams miss. If your campaign is concentrated and your reporting window is a calendar quarter, the quarter will always look worse than the campaign, because you are averaging six weeks of pressure across thirteen weeks of report.
The Similarweb chart that looks like a failure: 10M to 8.5M visits
Traffic to swarovski.com declined from about 10M monthly visits in January to about 8.5M in March 2026, averaging 9.2M across the quarter, according to Similarweb — the opposite of what an eight-figure media buy is supposed to produce.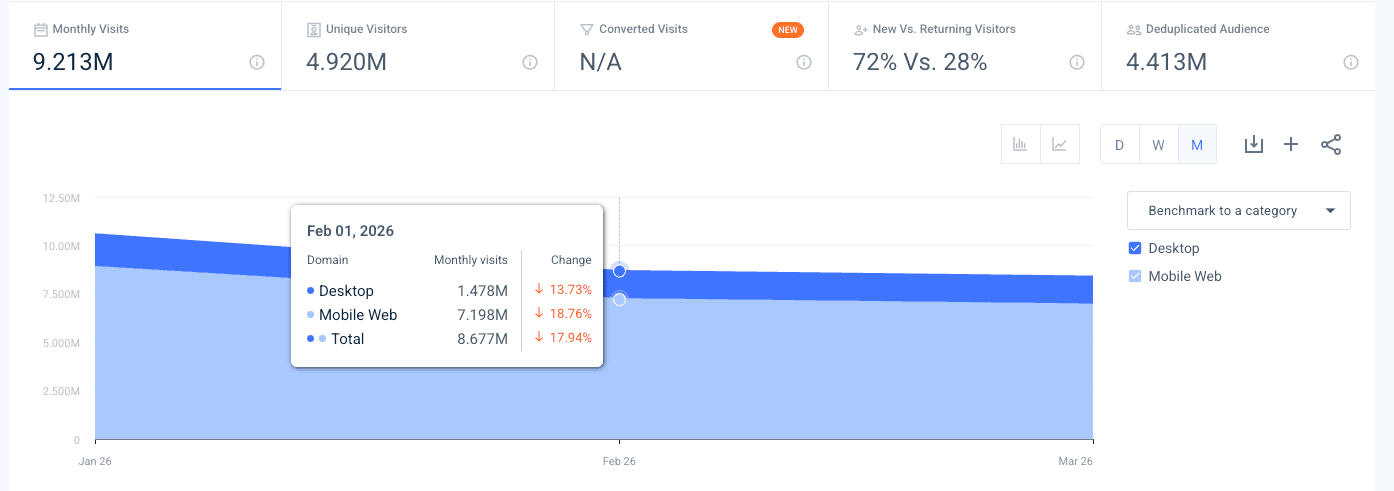
Before you write the post-mortem, three things.
Seasonality: what a jewelry brand's first quarter always looks like
January-to-March is the slide down from the Christmas peak, which is the shape a jewelry brand's traffic chart takes every year regardless of media weight. The honest question isn't why traffic fell. It's how much faster it would have fallen without the 373M views of Ariana Grande recorded by AdSee AI behind it. Google Trends offers one hint: search interest in Swarovski in 2026 is running about 40% above the same period in 2025.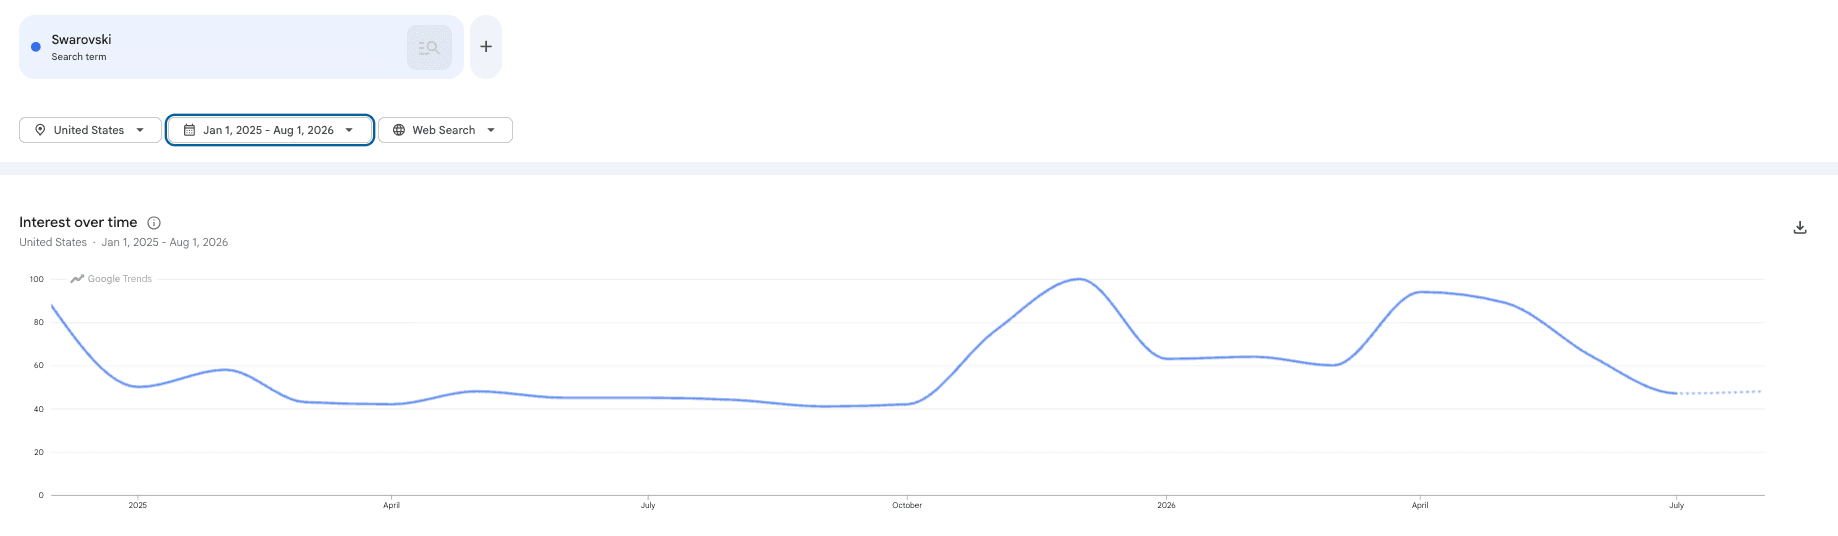
Composition beats volume: 72% new visitors and 83% mobile
The campaign's fingerprints are in the audience composition, not the visit count: Similarweb reports 72% new visitors and 83% mobile web traffic for swarovski.com over the campaign quarter. Seventy-two percent new is a strikingly cold mix for a 130-year-old house with a loyal base, and 83% mobile is exactly what you get when the top of the funnel is a portrait-format video tapped on a phone.
A brand that is losing relevance does not suddenly acquire a cold, mobile-first audience. It recirculates the same warm one. The composition is the campaign, even when the total is down.
The offline door that web analytics cannot see
Nobody buys a €510 crystal necklace because a banner told them to, and the scale of that blind spot is federal-statistics large: e-commerce accounted for 16.9% of total U.S. retail sales in Q1 2026, according to the U.S. Census Bureau, meaning more than four-fifths of retail spending happens somewhere a session-based analytics tool cannot follow.
Someone sees Ariana Grande wearing a dragonfly on YouTube in February and walks into a boutique in April. That walk is invisible. No UTM survives it. Omnichannel attribution systems try to stitch the journey together and they are getting better, but for most brands most of the time the thread snaps at the store door.
If your dashboard only measures the web, a campaign built to move people offline will always look like money on fire. It isn't. Your dashboard is measuring the wrong door.
What the likes gave away: 462 versus 56,417 in the same campaign
Two ads from the same shoot, released the same day, produced like counts three orders of magnitude apart — the 114.2M-view hero collected 462 likes while the 46.5M-view cutdown collected 56,417, per AdSee AI public counts read on July 5–6, 2026.
Do the division and the strategy falls out. The hero earned one like per roughly 247,000 views (114.2M ÷ 462, per AdSee AI counts). The cutdown earned one per roughly 824 (46.5M ÷ 56,417, per AdSee AI counts). Same star, same collection, same day, same footage.
How the like-to-view ratio works as a placement signal
Views can be bought; likes have to be earned, so the ratio between them is a public proxy for how the impressions were acquired. A like rate near zero is the signature of forced in-stream inventory — people watched because the ad played, not because they chose to. An anomalously high like rate means the creative reached people who wanted it: discovery placements, subscription feeds, fan traffic pressing thumbs-up on purpose.
The format difference behind that gap is measurable in the academic literature too. A 2025 study in the Journal of Advertising Research comparing skippable in-stream, non-skippable in-stream and in-video brand placement found that perceived intrusiveness varies sharply by format — which is precisely the variable a like rate is picking up when two identical creatives diverge by a factor of 300.
Where the like-to-view ratio lies
The ratio is a signal, not a verdict, and it fails in at least four specific situations worth naming before you build a report on it. Advertisers can disable likes entirely, which produces a zero that means nothing. Content aimed at children has engagement controls that suppress the count structurally. Comparing a Shorts placement against a standard in-stream buy compares two different engagement surfaces, so the numbers are not on the same scale. And the ratio says nothing about business outcome: a fandom-driven like rate tells you the audience was warm, not that anyone bought a necklace.
Use it the way it is used here — to compare creatives inside one advertiser's fleet, in the same window, in the same format. Across those boundaries it degrades fast.
Two engines inside one YouTube marketing campaign: reach and fandom
Swarovski was not running one campaign but two with the same footage, and the like split is the evidence: a reach engine buying eyeballs at one like per 247,000 views, and a fandom engine collecting enthusiasm at one per 824, per AdSee AI.
This is a more sophisticated buy than it looks. The reach engine does the job the CFO signed off on — impressions against a gifting window. The fandom engine does the job that keeps the collab alive after the media stops, because likes, comments and shares are the assets that keep a creative circulating on their own.
Google's own creative teams describe this shift away from a pure impressions frame. Suzana Apelbaum, global group marketing specialist for creative and innovation at Google Media Lab, has said her team used to see social platforms "through a reach and frequency lens" and now approaches creative experiments as a way to test how people actually respond to different ad types. Swarovski's two-engine split is what that idea looks like when a luxury house executes it with one shoot and four cuts.
You can read that entire media strategy from two public numbers, if you know to divide them.
The echo: how a Zagreb retailer and a DTC brand advertised on Swarovski's demand
After Swarovski went dark in March, the collab kept advertising without Swarovski — two other advertisers ran the same intellectual property with a combined estimated spend under $43K, per AdSee AI. The brand detonates, partners amplify, opportunists orbit.
The authorized retailer in Zagreb
On March 17, 2026, Elysées — an authorized multibrand retailer in Zagreb — ran a 30-second version of the collab film targeted at Croatia with an estimated $18.2K–$45.5K behind it, per AdSee AI. The creative was the official Swarovski asset; the landing page was the retailer's own Dragonfly capsule page, where the pieces sell for €149 to €510.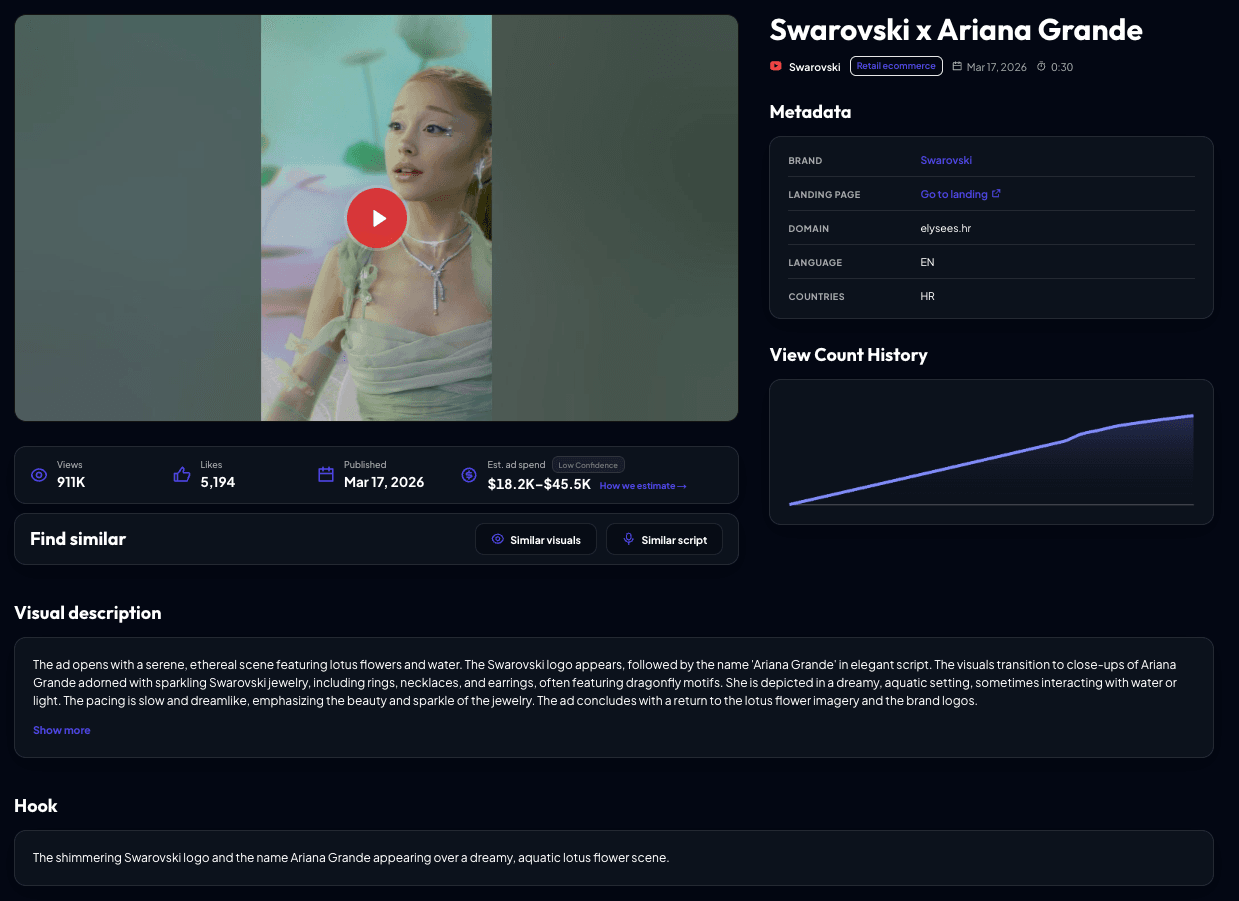
The global blitz created the demand; the local partner spent five figures to harvest it in a market the headquarters campaign never touched. For a UA or media buyer, that is the more repeatable lesson in this entire case: you don't need the celebrity budget to monetize the celebrity moment, you need the geography nobody bought.
Geography as a lifecycle signal in a YouTube ad tracker
A creative's country list tells you which stage of its life it is in, and Elysées' single-market Croatian buy — 1 country, an estimated $16.2K–$40.7K — is a textbook local-harvest placement rather than a test or a rollout, per AdSee AI placement data. The same reading applies to any advertiser you pull up in a YouTube ad tracker.
The four stages are consistent enough to use as a checklist. A creative running in a handful of small, cheap markets — Cyprus, Serbia, Kenya, Lithuania — is being tested, not launched. A coherent regional cluster is a rollout. Two or three sustained markets is focused scale. Fifty-plus countries including premium CPM markets is a global burn, and it means the creative has already won internally.
Swarovski's Ariana Grande fleet sits in the last category by construction: a gifting-moment buy has no time for a test phase, because the moment expires on February 14. That is also why the length ladder replaced a hook test — when the calendar is the constraint, you optimize the buy, not the idea.
Why this campaign is statistically abnormal, and when concentration is the wrong call
Concentrated spending is the exception rather than the rule in video, and the Swarovski case — 5 creatives and an estimated $7.4M–$18.4M inside 6 weeks, per AdSee AI — only works because three conditions coincided: a fixed cultural date, a product whose value is symbolic rather than functional, and a distribution network that could convert attention offline. Remove any one and the same calendar becomes a liability.
A subscription business with 12 monthly billing cycles has no February 14. A DTC brand without boutiques has no offline door to send anyone through, so the traffic decline would be a real decline rather than a measurement artifact. And a category where purchase is researched over weeks — insurance, software, appliances — punishes a six-week burst because the consideration window outlives the media.
How to run this teardown on a competitor with a YouTube ads spy tool
You can reproduce this entire analysis on any advertiser using public data plus one creative-level source, in about forty minutes. The steps below are the exact sequence used for Swarovski.
Step 1: pull the advertiser's creatives and sort by publish date
Start in a YouTube ads library and list every creative from the target advertiser over the last 6–12 months, then sort chronologically. Clusters and silences are the campaign structure. A single day carrying four creatives is a coordinated launch; four blank months are a strategy, not an oversight.
Step 2: divide likes by views inside each cluster
Compute the like-to-view ratio for every creative in the same window and compare within the cluster only. Ratios that differ by two or three orders of magnitude inside one campaign mean the advertiser is buying two different kinds of inventory, and that split tells you more about their media plan than any spend estimate.
Step 3: check the traffic chart before believing it
Pull the advertiser's monthly visits and audience composition, then ask whether the business converts online at all. If most revenue closes in stores, treat visit volume as a weak signal and read new-visitor share and device mix instead. Composition survives seasonality; totals don't.
Step 4: look for the echo advertisers
Search the same brand or collaboration name across other advertisers. Authorized retailers, distributors and opportunists running the same footage reveal which markets the brand left uncovered — and those gaps are usually where a smaller budget can still buy attention at a sane price.
Where this approach stops working
This method fails in 3 concrete situations, and the spend figures behind it are modeled rather than billed, which AdSee AI reports as a confidence level per creative rather than as a hard number. First, when the landing destination is an app store rather than a website, there is no traffic chart to cross-reference at all and the creative layer is the only visible evidence. Second, when an advertiser runs through an agency account or a regional entity with a different name, the creative list is incomplete and any spend total built from it is understated. Third, spend estimates are modeled from view counts and country-level CPV benchmarks, not from billing data — they are useful for comparing orders of magnitude between campaigns and misleading if quoted to the dollar.
None of that makes the exercise pointless. It makes it directional, which is the correct expectation for competitive intelligence built on public counters.
How we counted: methodology
The sample is 7 YouTube ad creatives referencing the Swarovski brand published January–June 2026 and identified in the AdSee AI YouTube ads library: 5 from Swarovski itself, 1 from Elysées and 1 from a small DTC advertiser. View and like counts come from public YouTube counters read on July 5–6, 2026; countries come from placement data. Creatives from the same advertiser within a ±60-day window are treated as one campaign. Spend estimates are views multiplied by country-level CPV benchmarks — US benchmarks of $0.02–0.05 per view — always presented as a range, with confidence levels as reported per creative by AdSee AI. Website traffic and audience composition: Similarweb, monthly visits for swarovski.com, January–March 2026. Search interest: Google Trends, "Swarovski", United States, 2026. Retail channel share: U.S. Census Bureau Quarterly Retail E-Commerce Sales, Q1 2026.
What to steal from the Swarovski YouTube ad campaign
Steal the shape, not the spend: concentrated beats constant when the product is desire rather than utility, so if you sell moments, advertise in moments and let the calendar do the targeting.
Steal the measurement humility. Before declaring a campaign dead, ask which door your customers actually walk through — with more than four-fifths of U.S. retail closing outside e-commerce per Census Bureau data, web analytics is a keyhole rather than a window for a large share of businesses.
Steal the likes-per-view division. It is free, it is public, and it tells you where any competitor bought their audience, provided you compare inside one advertiser's fleet rather than across formats.
Steal the echo audit. Find the markets your competitor's headquarters campaign never bought, then buy them at local prices while their demand is still warm.
Don't steal the celebrity. If your entire year's budget fits inside one week of this campaign, a famous face won't save you — it will spend you out quietly and politely.
FAQ
How much did the Ariana Grande x Swarovski YouTube ad campaign cost? According to AdSee AI estimates, the five Swarovski ads featuring Ariana Grande published between January 13 and February 26, 2026 correspond to $7.4M–$18.4M in combined media spend against roughly 373M total views. Spend figures are modeled from view counts and country-level CPV benchmarks, so they should be read as an order of magnitude rather than a billed amount.
Why did Swarovski's website traffic fall during the Ariana Grande campaign? Per Similarweb, swarovski.com visits fell from about 10M in January to about 8.5M in March 2026, which follows normal post-Christmas seasonality for jewelry. Google Trends shows Swarovski search interest running roughly 40% above 2025, and the campaign's effect appears in composition — 72% new visitors, 83% mobile — and in boutiques, which web analytics cannot measure.
How many ads were in the Swarovski Valentine's and Dragonfly campaign? Per AdSee AI, five: one Valentine's Collection ad published January 13, 2026 with 83M views, and four Ariana Grande x Swarovski Dragonfly capsule ads released on February 26, 2026 with 114.2M, 91M, 46.5M and 37.9M views. No new Swarovski brand creatives appeared from March through June 2026.
What do likes reveal about a YouTube ad campaign? The like-to-view ratio indicates how the views were acquired. In the Swarovski case, AdSee AI data shows the 114.2M-view hero earned 462 likes — one per roughly 247,000 views, the signature of forced in-stream reach — while the 46.5M-view cutdown earned 56,417, or one per roughly 824, indicating discovery and fan-driven placements.
How do you find a competitor's YouTube ads? Search the advertiser or brand name in a YouTube ads library such as the AdSee AI database, then sort every creative by publish date to expose launch clusters and silent periods. Add like-to-view ratios per creative and the country list per placement, and you can reconstruct most of a competitor's video media plan from public data alone.
Who else advertised with the Ariana Grande x Swarovski collaboration? Per AdSee AI, Elysées — an authorized Swarovski retailer in Zagreb — ran the official collab film for the Croatian market in March 2026 with an estimated $16.2K–$40.7K spend, and a small DTC jewelry brand ran a sub-$2K ad in May 2026 using the collaboration's name in its title, collecting 35.6K views and zero likes.
Is a high like rate worth optimizing for on YouTube ads? Not directly. A like rate is a diagnostic of where impressions came from, not a business outcome, and per AdSee AI data the Swarovski creative with the highest like count was not the one carrying the most reach. Optimizing for likes buys cheaper engagement surfaces, which may or may not be where your buyers are.
How much of retail spending can YouTube ad performance not be measured against online? E-commerce accounted for 16.9% of total U.S. retail sales in the first quarter of 2026, according to the U.S. Census Bureau, meaning the large majority of purchases close in physical channels. For brands like Swarovski that sell mainly through boutiques, a campaign judged only by website visits is being scored on a minority of its actual outcome.
Data and sources
Ad creatives, view and like counts, countries, publish dates and spend estimates — the AdSee AI YouTube ads library. Website traffic and audience composition — Similarweb. Search interest — Google Trends. Retail channel share — U.S. Census Bureau, Quarterly Retail E-Commerce Sales, Q1 2026. Ad format and intrusiveness research — Journal of Advertising Research, 2025. Creative testing practice — Think with Google. Retailer collection page — elysees.hr.