
I'm going to save you forty minutes of scrolling through "top mobile game ads" listicles that all say the same nothing.
Here are four mobile game ads that actually worked in 2025–2026, with the receipts: view counts, like counts, spend estimates, country lists and publish dates, pulled from the AdSee AI YouTube ads library. Put them side by side and they turn out to be running the same play, even though they look nothing alike.
None of them look like ads. Every one is camouflaged as content the viewer was already going to watch. And every one has a public number attached that proves the camouflage worked.
That number is the like count.
What makes an effective YouTube ad in mobile gaming in 2026?
An effective mobile game ad in 2026 is one the viewer chooses to watch rather than tolerates, and the cheapest public proof of that choice is the like-to-view ratio. Across the four campaigns in this teardown, ratios land between one like per 82 views and one per 365 — content-level engagement rates that forced advertising almost never reaches.
Google's own research points in the same direction. In a creative experiment documented by Think with Google, skippable creator-led ads produced 49% higher watch time and 128% higher consideration than the control, which cut the cost per lifted user by 56%. Suzana Apelbaum of Media Lab, quoted in the same write-up, framed the shift plainly: "to break through on any platform, being relevant is key."
Google's creative guidance for skippable in-stream says it even more bluntly. In its Create with Google deck for the format, the argument is that "people don't hate ads, they hate bad ads."
Academic work supports the mechanism. A 2025 study in the Journal of Advertising Research comparing skippable ads, non-skippable ads and in-content brand placements found that the non-interruptive formats are perceived as meaningfully less intrusive, and that combining skippable creative with placement-style integration can match the brand recall of forced views at lower cost.
The camouflage test
Every ad below passes one test: if you stripped the store badge off the end card, you could plausibly mistake it for something a creator uploaded. A stream clip. A meme edit. A Minecraft-style build video. A quiz.
That isn't a stylistic preference. It's an arbitrage on attention pricing. Paid reach costs the same whether the viewer resents it or not, so the entire margin sits in whether they lean in.
Why the like count is the receipt
Views are a budget report. They tell you what the advertiser bought, not what the audience did.
The like is the only public action that costs the viewer something — a tap, an account, a small act of endorsement. Nobody endorses an interruption. When a paid instream video collects likes at rates you'd expect from organic content, that's the audience telling you, in public, that they didn't experience it as advertising.
Example 1: the OBBY ad that pretends to be a live stream
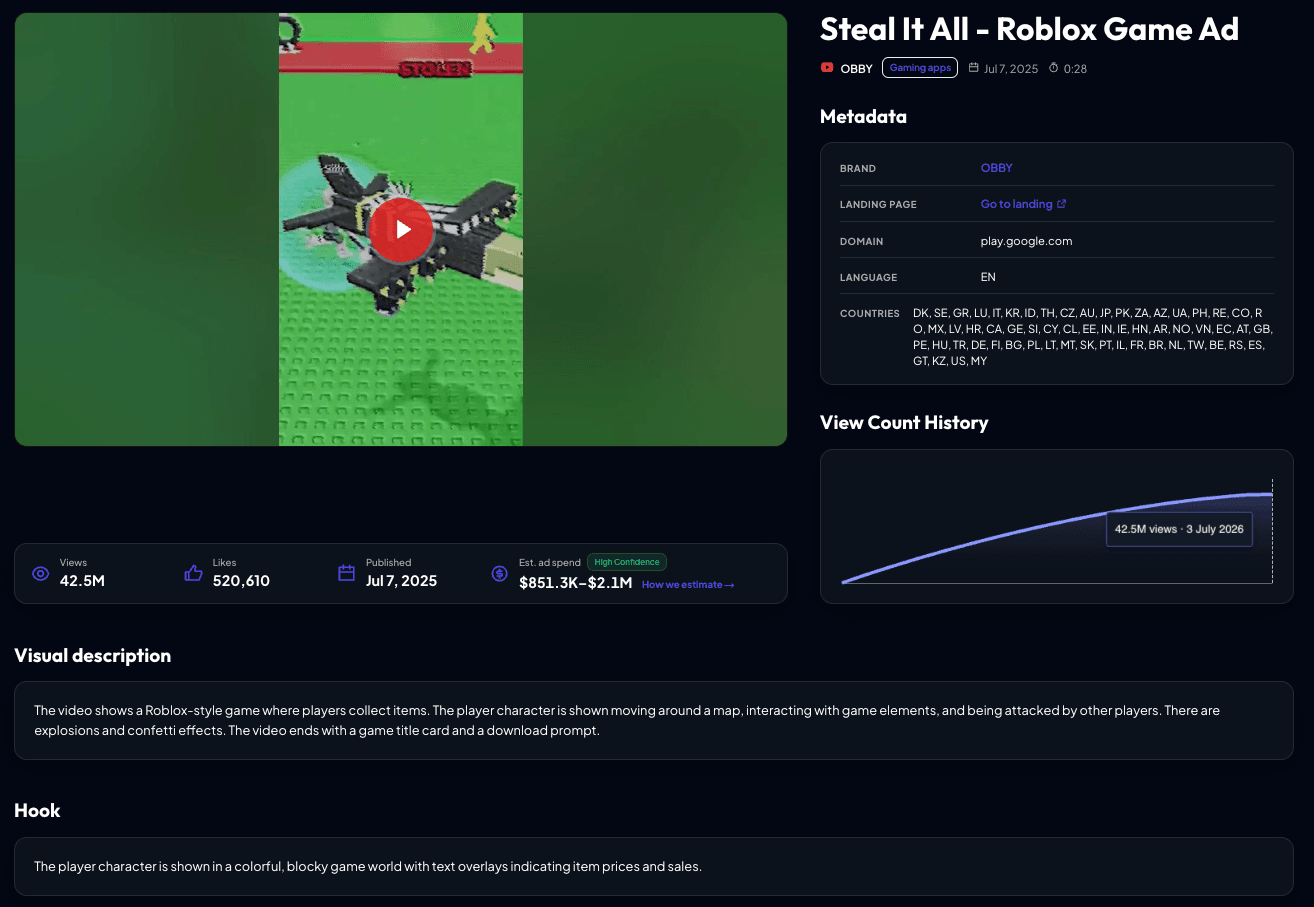
OBBY's ad works because it replaces ad copy with streamer voiceover, and the audience responded at content rates: 42.5M views and 520,610 likes, one like per 82 views, per AdSee AI.
The creative, "Steal It All – Sneak or Get Busted", is a Roblox-style gameplay clip narrated with the excited, reactive "no way, no way, NO WAY" cadence you hear on every gaming stream your kid watches.
What the numbers say
Per AdSee AI, the creative was published on July 7, 2025 and had reached 42.5M views by late June 2026, against an estimated $851.3K–$2.1M in spend at high confidence. It ran in roughly 60 countries, from the US, UK, Germany and Japan through to Vietnam and Kazakhstan.
The like ratio is the headline: one per 82 views. For a paid instream placement, that is not a normal number.
Why the streamer voice works
The streamer voice isn't a gimmick, it's borrowed trust. A scripted VO announces that a transaction is being attempted. A stream voice signals that something is happening in real time and the narrator is as surprised as you are.
The ad sounds like someone the viewer already believes. That's the whole trick, and it costs less than a polished production.
Example 2: the Poki ad that pretends to be a meme
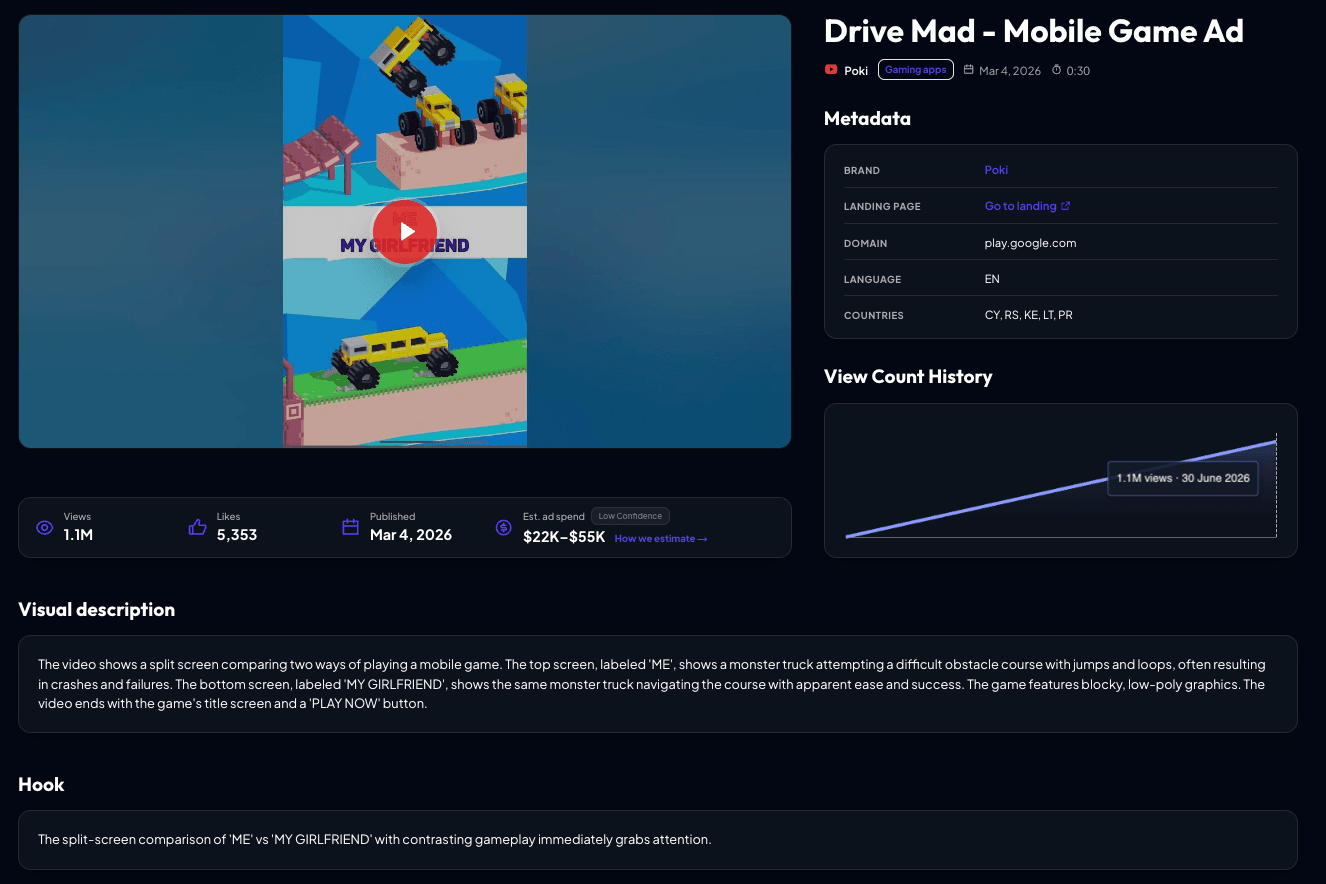
Poki's Drive Mad creative is a market test, not a launch, and the country list gives it away: Cyprus, Serbia, Kenya, Lithuania and Puerto Rico, per AdSee AI.
The ad itself is a split-screen: "ME" on top nailing a monster-truck obstacle course, "MY GIRLFRIEND" below crashing the same truck over and over. It's built to look like the ironic organic clips flooding every feed, and yes, the format deliberately runs on a gender stereotype. That polarity is the engagement engine: half the comments defend, half attack, and the algorithm counts all of it as interest. I'm not telling you to like the joke. I'm telling you to understand the mechanism.
What the numbers say
Published March 4, 2026. 1.1M views by June 30 on a modest $22K–$55K estimate, with 5,353 likes — one per 206 views, per AdSee AI. Still comfortably content-level engagement.
Why the country list matters more than the view count
Cyprus, Serbia, Kenya, Lithuania, Puerto Rico. That's not a rollout, that's a lab.
These are small, cheap markets where a creative gets pressure-tested before real money touches it. If you're benchmarking yourself against this ad's view count, you're benchmarking against a rehearsal and calling it the show.
Example 3: the Apollo Publishing ad that pretends to be Minecraft
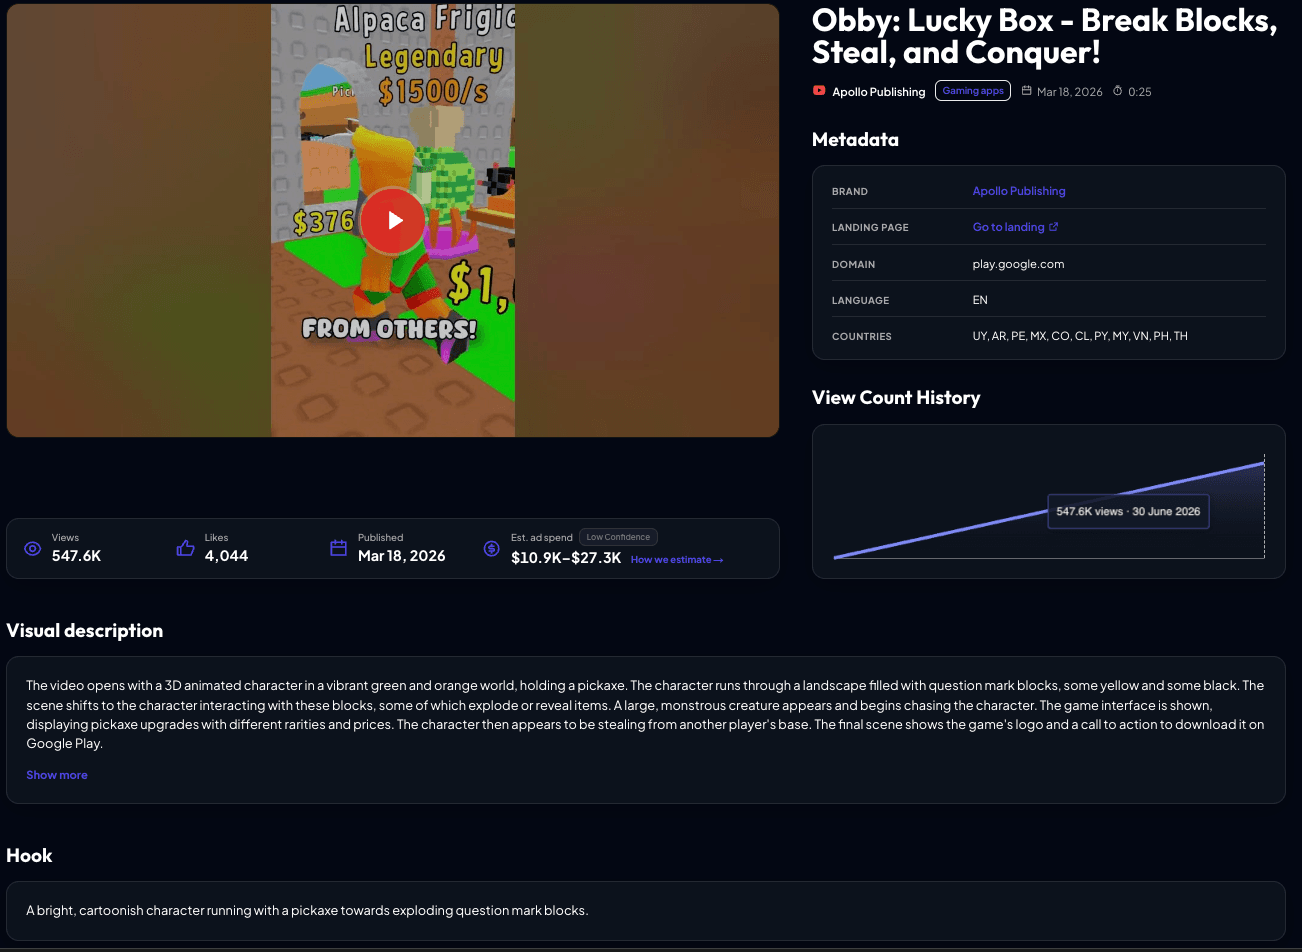
Apollo Publishing's Obby: Lucky Box ad borrows Minecraft's visual language to buy instant familiarity, and it converts attention at one like per 135 views on a four-figure-to-low-five-figure budget, per AdSee AI.
The creative speaks fluent block-world: low-poly terrain, a character with a pickaxe, exploding question-mark loot blocks. To be precise, this is about visual language, not the game itself. The ad borrows the most recognizable aesthetic in gaming so the viewer's brain files it under "familiar" before a single second of persuasion happens.
What the numbers say
Published March 18, 2026. 547.6K views by June 30 on an estimated $10.9K–$27.3K, targeted across Latin America and Southeast Asia: Uruguay, Argentina, Peru, Mexico, Colombia, Chile, Paraguay, Malaysia, Vietnam, the Philippines and Thailand. 4,044 likes, one per 135 views, per AdSee AI.
Familiarity as a discount on attention
Small budget, mid-size numbers, but the like rate says the camouflage works.
Recognition is a shortcut through the most expensive part of the funnel: the first two seconds, where the viewer decides whether this is worth their attention. Borrowing an aesthetic the audience has already spent years learning is the cheapest attention hack available, and it requires no media budget at all.
Example 4: the Drift Max Pro ad that pretends to be a quiz
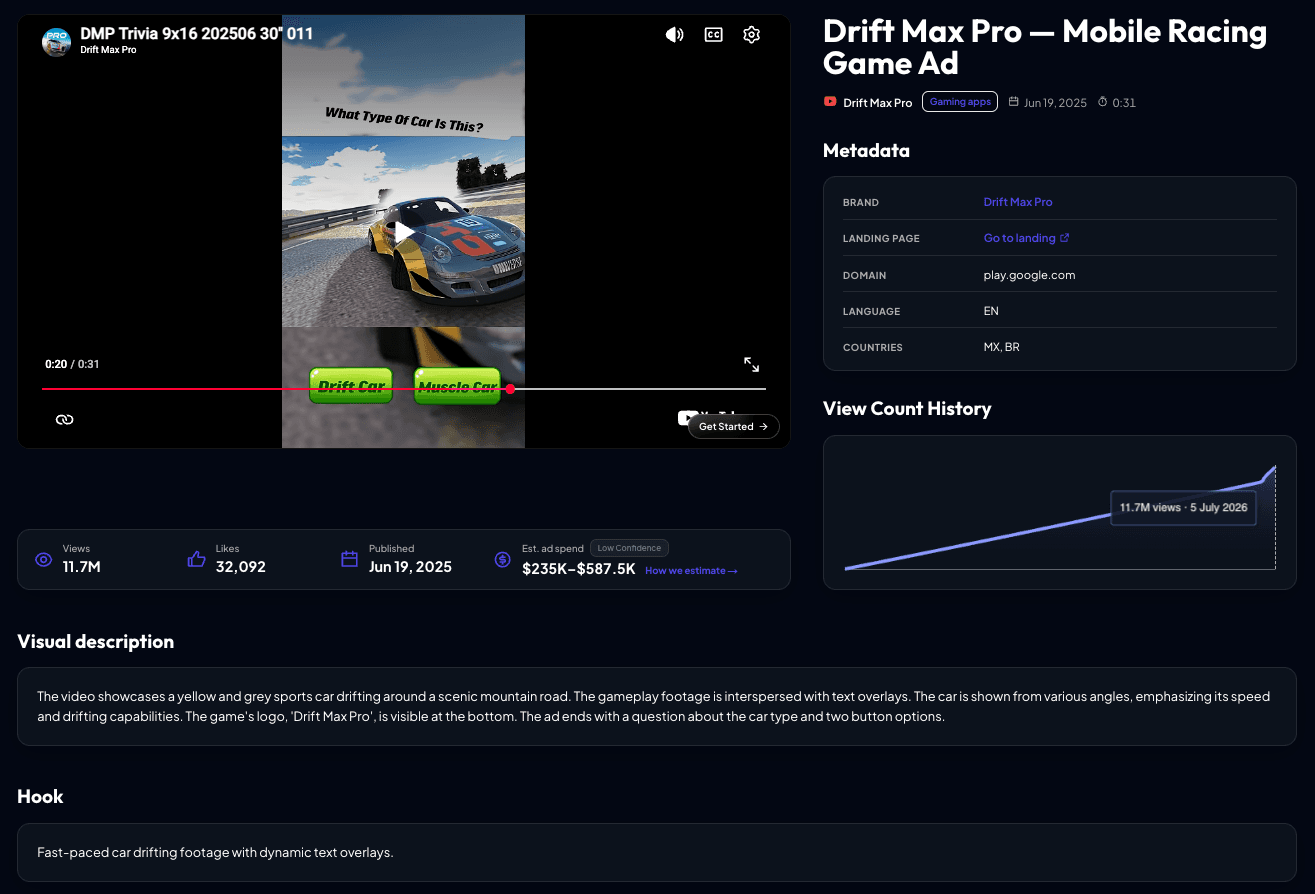
Drift Max Pro turns its call to action into a quiz question, and that single interactive beat kept the creative alive for thirteen months: from zero to 11.7M views between June 2025 and July 2026, per AdSee AI.
The ad is raw gameplay — a car drifting down a mountain road under high-energy music. Twenty seconds in, a question pops up: "What car is this?" Two buttons: Drift Car. Muscle Car. The last ten seconds just hold there, waiting for you to answer.
That question is a CTA wearing a quiz costume. The tap that answers it is the tap that starts the install.
What the numbers say
Published June 19, 2025, and the view curve is the story: still climbing a year after launch, reaching 11.7M views by July 2026 on an estimated $235K–$587.5K, focused on Mexico and Brazil. 32,092 likes, one per 365 views, per AdSee AI.
The CTA in a quiz costume
Zero production budget. One interactive beat. A creative still alive thirteen months later.
Participation is cheaper than production, and it lasts longer, because a question doesn't wear out the way a punchline does. The viewer isn't being told something they've now heard. They're being asked something, and the asking resets on every impression.
The scoreboard: what the top YouTube ads in mobile gaming have in common
Four ads, one pattern: each disguises itself as native platform content and each earns likes at rates paid media isn't supposed to get.
| Advertiser | Views | Like ratio | Format it imitates |
|---|---|---|---|
| OBBY | 42.5M | 1 per 82 | Live stream |
| Poki | 1.1M | 1 per 206 | Meme edit |
| Apollo Publishing | 547.6K | 1 per 135 | Familiar block-world game |
| Drift Max Pro | 11.7M | 1 per 365 | Quiz |
For context: in forced instream campaigns from large consumer brands analyzed with the same method, AdSee AI shows like rates falling to one per 100,000 views or worse. The distance between one per 82 and one per 100,000-plus is the measurable difference between content people choose and advertising people endure.
Why the like-to-view ratio works as a creative lie detector, and where it lies
The like-to-view ratio is the most honest public metric available on a YouTube ad, because it is the only one that requires a deliberate act from the viewer rather than a purchase from the advertiser. It is also not a performance metric, and treating it as one will cost you money.
What it actually measures
It measures voluntary approval per unit of purchased reach. Nothing more.
That is genuinely useful, because it's the one number in a competitor's campaign you can read without access to their account, and it separates "this creative was seen" from "this creative was wanted."
Four cases where it misleads
Likes are hidden or disabled. Plenty of advertisers turn them off. Absence of a ratio is a data gap, not a bad score.
Kids and family content skews low. Younger audiences are less likely to hold accounts and less likely to like anything. Compare within an audience segment, not across.
Format mixing breaks comparability. Shorts placements, bumper and skippable in-stream all count a "view" differently. Compare like for like, or the ratio is arithmetic without meaning.
It says nothing about installs, retention or payer quality. A creative can be adored and still send you users who churn on day one. The ratio diagnoses attention. It does not diagnose the business.
Use it to decide which competitor creative deserves a teardown. Do not use it to decide what to scale.
Why a thirteen-month creative is statistically abnormal
Drift Max Pro's ad is an outlier because the industry is moving in the opposite direction: creative iteration rates are rising, not falling, which means the average asset's useful life is getting shorter.
The 2026 mobile gaming marketing trends whitepaper published on Business of Apps describes a market where advertiser scale and creative iteration rates both increased year over year, with short-form video becoming the dominant format. Translated into UA reality: teams are shipping more variants, faster, because assets stop working sooner.
Against that backdrop, a single creative still accumulating views thirteen months after publication is not a rounding error. It's a signal that whatever it's doing sits outside the normal fatigue curve.
The likeliest explanation is the interaction. A joke has one payload and delivers it once. A question has no payload — it hands the work to the viewer, and the viewer supplies fresh engagement on every impression. That's a structural difference, not a creative-quality difference, which is why it's replicable at any budget.
What the country lists reveal about buying strategy
Geography is the most underread field in any YouTube ads library, because a creative's country list is a public readout of which lifecycle stage the campaign is in.
Across these four campaigns, the ladder is visible in a single table:
Test. Poki: Cyprus, Serbia, Kenya, Lithuania, Puerto Rico. Small, cheap, low-stakes. The advertiser is buying information, not installs.
Regional rollout. Apollo Publishing: eleven markets clustered across Latin America and Southeast Asia. The creative has cleared testing and is being pushed into coherent regional blocks where CPMs are still manageable.
Focused scale. Drift Max Pro: Mexico and Brazil only, sustained for over a year. This is a proven asset being run hard in the two markets where the economics work, rather than spread thin.
Global burn. OBBY: roughly 60 countries including the US, UK, Germany and Japan. Premium markets are in the mix, which means the advertiser has enough confidence in downstream monetization to pay premium CPMs.
If you're using a YouTube ad tracker to size up a competitor, read the country list before the view count. Views tell you what they spent. Countries tell you what they believe.
Why there's no Similarweb chart in this article
There is no Similarweb chart here because all four ads land on play.google.com, where web analytics has no visibility at all.
The entire funnel — view, tap, install, session — happens inside YouTube and the app store and never touches an open website. There's no traffic curve to show, because there is no web traffic. Google Trends is equally blind: nobody searches for a hyper-casual game by name; they see it, tap it, and are playing it inside a minute.
That's the uncomfortable structural truth of mobile gaming UA. Creative-level ad intelligence — views, likes, spend estimates, country lists, publish dates, view-curve shapes — is the only competitive research layer that exists for this category. In this article that layer comes from the AdSee AI YouTube ads library.
How to audit a competitor's YouTube ads library in thirty minutes
You can reproduce this entire teardown on any competitor with nothing but public data and a YouTube ads spy tool. Here's the sequence.
1. Pull every creative for the advertiser, sorted by publish date. You're looking for the shape of their output over time: bursts, gaps, and how many variants they ship per month.
2. Compute like-to-view for each creative. Two columns, one division. Rank them. The top of that ranking is where their real learning is, regardless of what they spent.
3. Read the country lists as lifecycle stages. Test, regional rollout, focused scale, global burn. Anything sitting in test markets is a creative they're not confident in yet — and a preview of what they'll scale next quarter.
4. Find the oldest creative still gaining views. That single asset is worth more study than their ten newest. Longevity in this category is rare enough that it's almost always structural.
5. Ask what each top creative is imitating. Not what it says — what it's dressed as. Stream, meme, familiar game, quiz, tutorial, reaction. That's the transferable part.
6. Check publish dates against their store launch. Ads that predate a launch are seeding, and seeding schedules are strategy documents that nobody thinks to hide.
Thirty minutes of this beats a quarter of guessing.
Where the camouflage strategy stops working
Camouflage buys attention. It doesn't buy a business, and there are three places it reliably backfires.
When the ad oversells the game. Fake-gameplay creative is the oldest trick in mobile UA and it still produces the same result: strong install volume, brutal day-one churn, and a cohort that never pays. Camouflage that misrepresents the product isn't a growth tactic, it's a refund liability — and app stores have grown far less tolerant of it.
When the genre can't wear the costume. Midcore and 4X titles that run casual-style camouflage buy the wrong audience at the right price. Cheap installs from players who will never engage with the core loop are more expensive than expensive installs from players who will.
When it's covering for a weak loop. Native-looking creative widens the top of the funnel. If retention is broken, all you've done is fill a leaking bucket faster and pay for the privilege.
How we counted
This analysis covers four mobile gaming YouTube ad creatives published between June 2025 and March 2026, identified in the AdSee AI YouTube ads library.
View and like counts are public YouTube counters as of the date shown on each creative's view-count history, between June 26 and July 5, 2026. Country lists come from placement data. Spend estimates are AdSee AI's, derived from view volume and country-level CPV benchmarks, and are always reported as ranges with a confidence level attached per creative; multi-country campaigns weighted toward cheap markets sit at the lower end of their ranges rather than the middle. Like rates are calculated as views divided by likes and rounded to the nearest whole number.
The forced-instream comparison figure is drawn from large consumer-brand campaigns analyzed in the same database using the same method.
What to steal
Dress your ad as the content your player already watches. Streamer audio, meme formats, familiar visual language, interactive beats. Pick the camouflage that fits your genre, and don't pick one that misrepresents the game.
Test in cheap markets before you scale. Poki's Cyprus–Serbia–Kenya mix is the playbook: rehearse for four figures, perform for six.
Add one participation beat. A single question with two buttons kept Drift Max Pro's creative alive for over a year. Interaction outlasts production value because it resets on every impression.
Judge competitors by like rate, not view count. Views show budget. The like-to-view ratio shows whether the creative earned attention or rented it.
Read the country list first. It tells you what stage the campaign is in before you've looked at a single frame.
FAQ
What are the best mobile game ad examples in 2026? Four standouts tracked in the AdSee AI YouTube ads library: OBBY's streamer-style Roblox ad (42.5M views, 520,610 likes), Poki's meme-format Drive Mad split-screen (1.1M views), Apollo Publishing's Minecraft-styled Obby: Lucky Box ad (547.6K views), and Drift Max Pro's interactive quiz-format gameplay ad (11.7M views over thirteen months).
What makes a mobile game ad effective? The common pattern across top performers, per AdSee AI data, is native camouflage: the ad imitates content the viewer already watches — streams, memes, familiar game aesthetics, quizzes — and earns content-level engagement, with like rates between one per 82 and one per 365 views.
How do you measure mobile game ad performance without website analytics? Mobile game ads land on app store pages, so Similarweb and Google Trends show nothing. The available layer is creative-level ad intelligence — views, likes, spend estimates, countries and view-curve dynamics — which in this analysis comes from the AdSee AI YouTube ads library.
How much do mobile game YouTube ads cost? In this sample, AdSee AI estimates range from $10.9K–$27.3K for Apollo Publishing's regional campaign to $851.3K–$2.1M for OBBY's roughly 60-country rollout, with spend scaling by market mix rather than by creative quality.
Why do some game ads run for over a year? Interactive formats age slowly. Drift Max Pro's quiz-style creative, published June 2025, was still gaining views in July 2026 per AdSee AI's view-count history. A single participation element ("What car is this?") kept engagement alive long past the typical creative burnout window.
How do you find a competitor's YouTube ads? Use a YouTube ads library or YouTube ad tracker that indexes creatives by advertiser and exposes publish dates, view counts, country lists and spend estimates. In this analysis those fields come from AdSee AI. Sort the competitor's creatives by publish date, compute like-to-view for each, and read the country lists as lifecycle stages.
Which countries do mobile game advertisers use to test creatives? Small, low-CPM markets. In this sample, Poki's Drive Mad creative ran in Cyprus, Serbia, Kenya, Lithuania and Puerto Rico, per AdSee AI — a country list that indicates a test rather than a rollout. Regional clusters such as Latin America or Southeast Asia indicate a creative that has already cleared testing.
Is a high like rate on a YouTube ad worth optimizing for? Not directly. The like-to-view ratio is a diagnostic for whether a creative earned voluntary attention, and it is the best public signal available on a competitor's campaign. It says nothing about installs, retention or payer quality, so it belongs in competitive research rather than in your own bidding strategy.
Data and sources
Ad creatives, view and like counts, publish dates, country lists, spend estimates and view-count histories: the AdSee AI YouTube ads library. Original ads referenced are publicly viewable on YouTube.
Creative-effectiveness research: Think with Google, video ad creative experiments. Format-intrusiveness research: Journal of Advertising Research (2025), comparative analysis of skippable ads, non-skippable ads and brand placements. Creative guidance for skippable in-stream: Create with Google. Market and creative-iteration trends: 2026 mobile gaming marketing trends whitepaper, published on Business of Apps.