
The best YouTube ad examples for your business are not the ones on "top 10 ads of the year" lists. They are the ads your direct competitors keep paying to run, and in the AdSee AI YouTube ads library you can spot them by combining five signals: likes relative to views, estimated spend, cost per view, view growth over time, and the countries an ad runs in.
This guide shows you how to search for those ads, what every number on an ad card means, and how to turn a proven creative into a script for your own brand. You do not need a big budget to follow along. You need about fifteen minutes and a clear idea of what "working" means for you.
Why most lists of the best YouTube ad examples won't help your campaign
Most published lists of the best YouTube ad examples feature global brands with production and media budgets that a typical advertiser cannot match, so they teach taste rather than strategy. A beautifully shot ad from a household-name brand tells you very little about what will convince a buyer in your niche, in your country, at your price point.
Those lists also rank ads by fame. Fame is a poor proxy for performance. An ad can go viral and never pay back its budget, while an unremarkable 20-second clip can quietly run for a year because every dollar spent on it returns more than a dollar. The second ad is the one you want to study, and it will never appear in a roundup.
The useful question is narrower: which ads are working for companies that sell what you sell, to the audience you want? Answering it requires data, not opinions.
The advantage of studying your own niche
Ads in your niche have already been tested against your audience. Your competitors paid for the impressions, the failed hooks and the creative iterations. When a competitor keeps an ad running, that decision is a signal you can read for free.
What you need before you start
You need a YouTube ads library that indexes more than titles, a list of three to ten competitors or category keywords, and a definition of success. The last item matters most, so we start there.
Step zero: define what an effective YouTube ad means for you
An effective YouTube ad is whichever ad best achieves your specific goal, and that goal decides which metrics you should look at first in AdSee AI. There is no universal "best". Before you open a single card, choose your definition.
Here are the three most common definitions and the metrics that match them:
- Maximum reach. You want the ad that got the most eyes. Focus on views and on view growth over time.
- Cheapest attention. You want the ad that bought views most efficiently. Focus on the ratio between estimated spend and views, which gives you cost per view.
- Genuine engagement. You want the ad people chose to watch and enjoyed. Focus on the like-to-view ratio.
A fourth definition sits on top of all three: proven longevity. An ad that has been running for months, with views still climbing, is almost always profitable for its owner. Advertisers switch off losing creatives quickly.
Write your definition down. It will stop you from being dazzled by a big view count that has nothing to do with your goal.
How to search the AdSee AI YouTube ads library
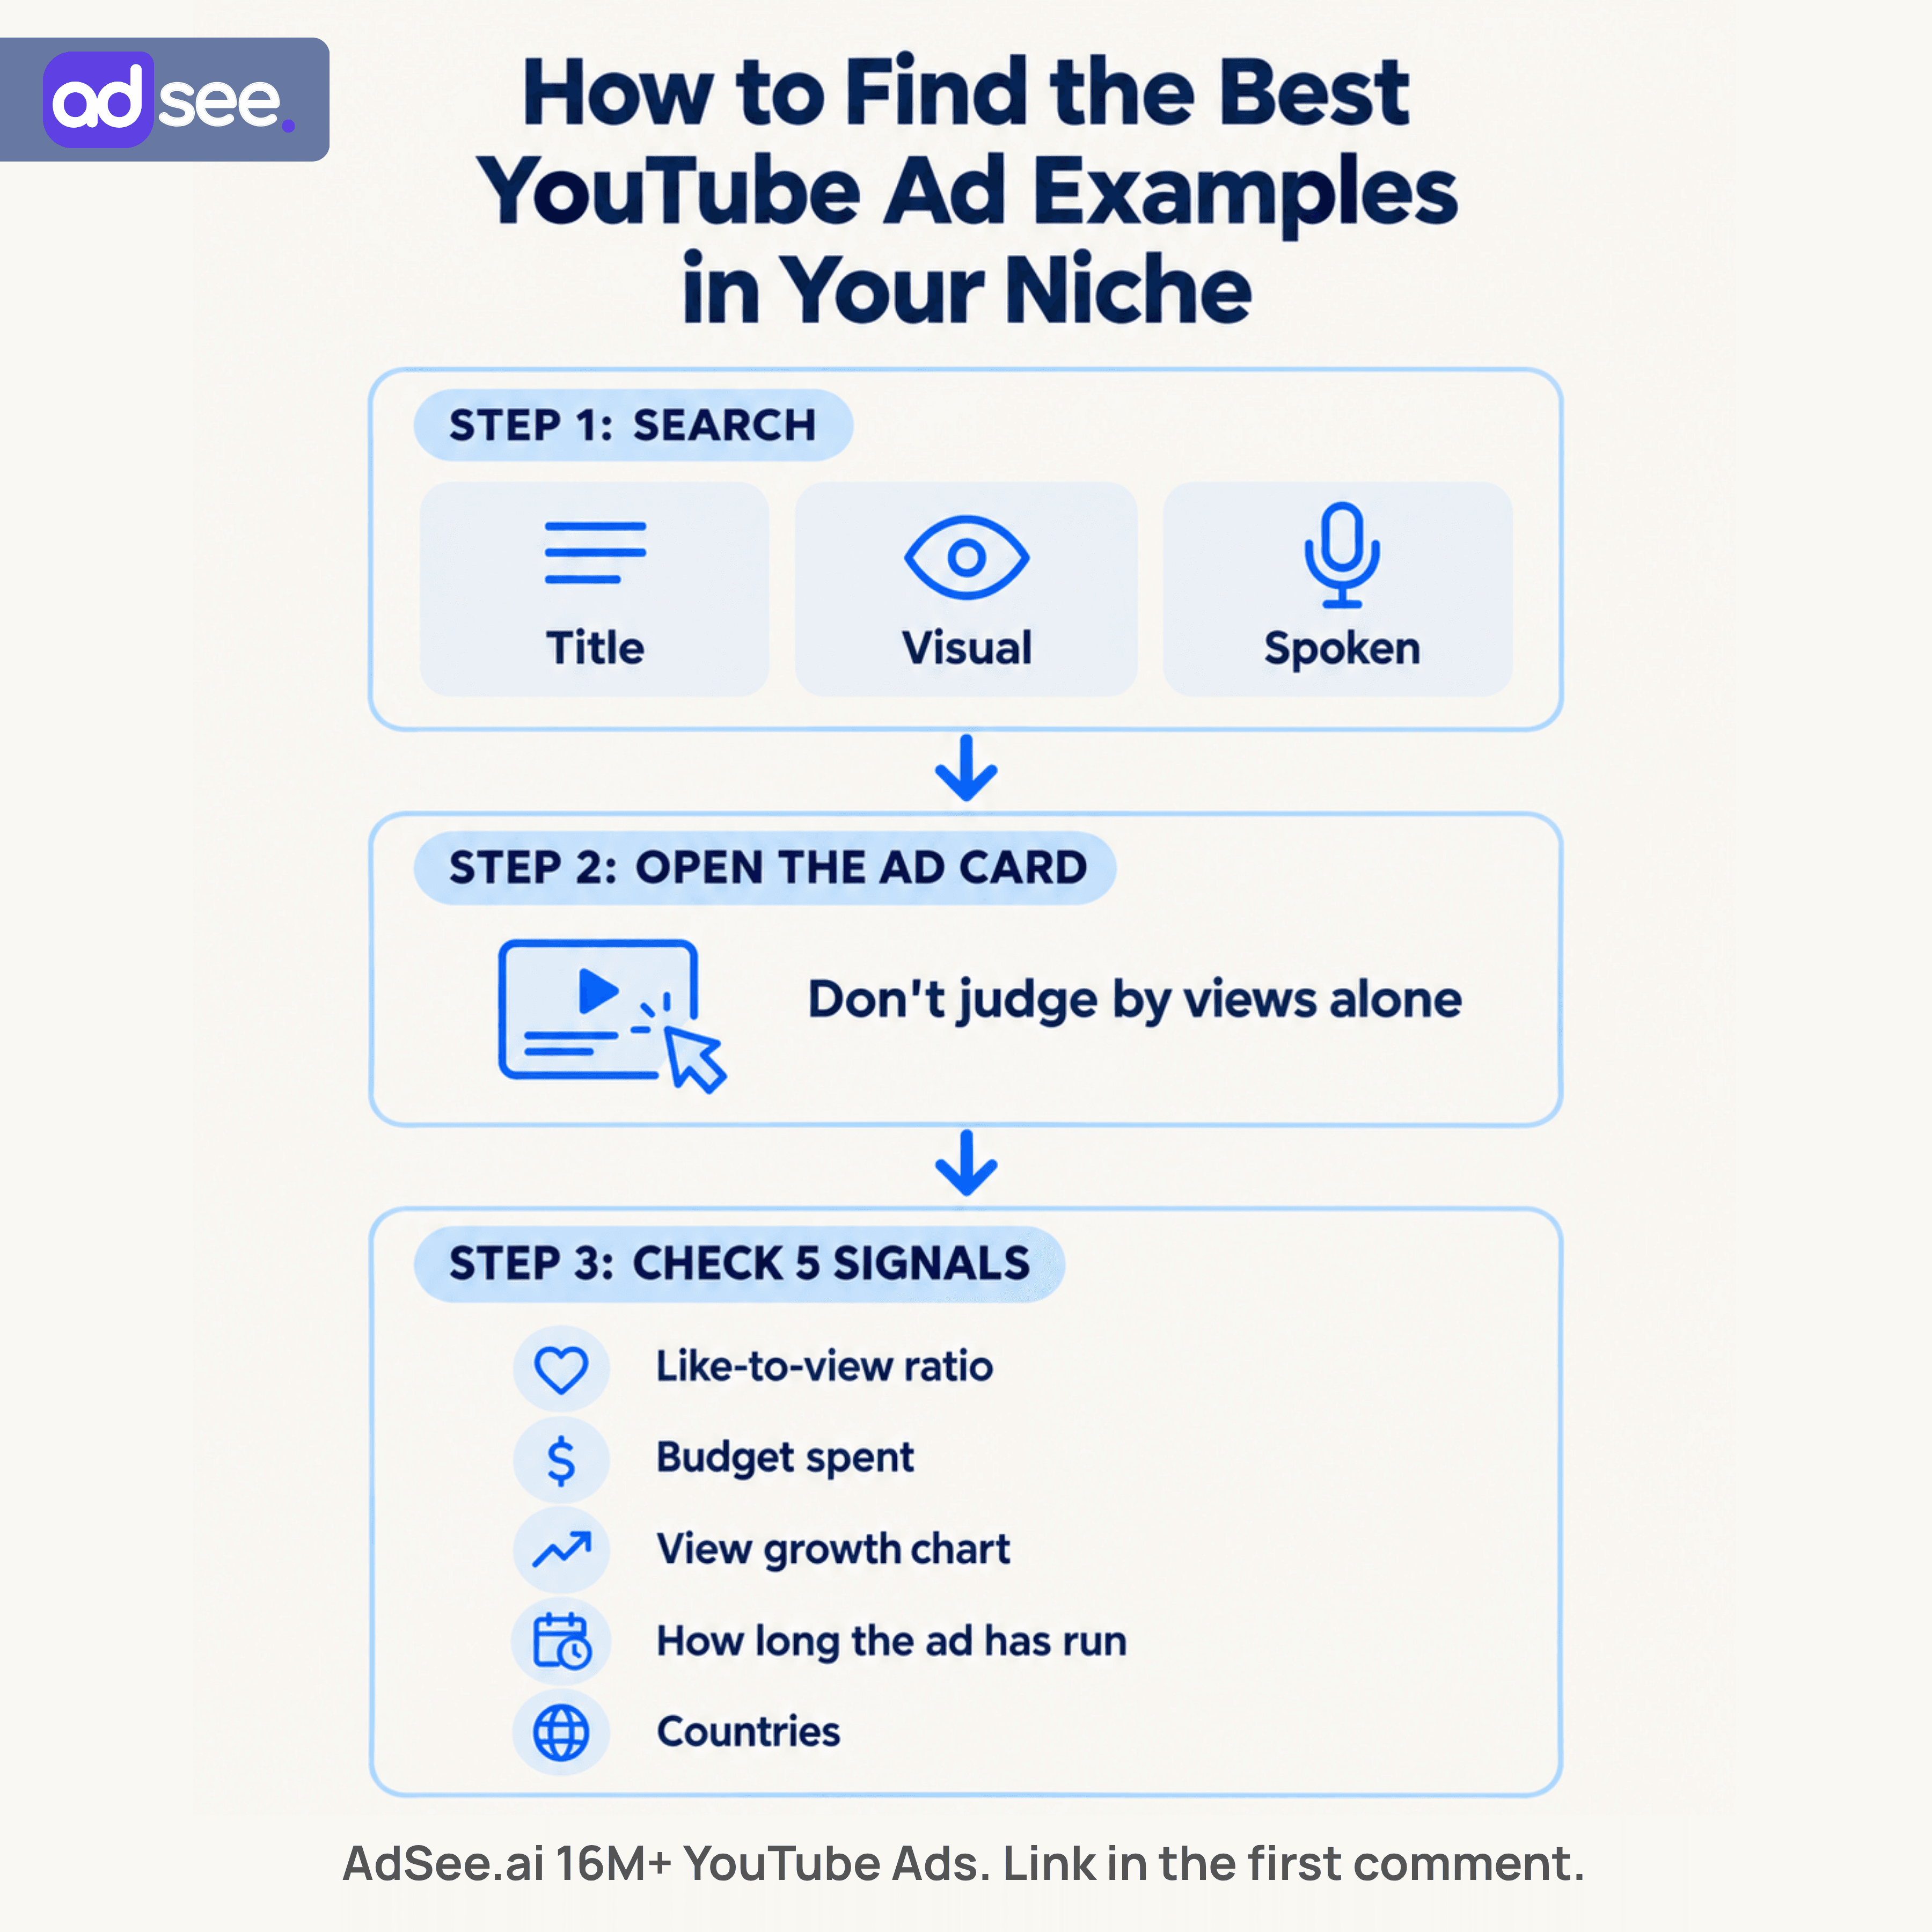
AdSee AI lets you search YouTube ads by their text, by their spoken and on-screen content, by their visuals, and by country, which means you can find ads based on what they say and show rather than what their owners typed into the title. That matters because most ad titles are useless. A file named "Untitled_final_v3" with a link in the description tells you nothing, yet the ad itself may contain exactly the offer you are researching.
Each search mode answers a different research question. Use them together.
Search by title and description
Title and description search is the fastest way to find ads from a specific brand or product line. Use it when you already know a competitor's name, product name or campaign slogan. It is the least powerful mode, because many advertisers leave these fields almost empty.
Search by content: what is said and written in the ad
Content search looks inside the ad. AdSee AI transcribes the spoken words and reads the text that appears on screen. Search for a phrase like "money-back guarantee", "free trial" or "cancel anytime", and you will find ads that say it out loud or flash it on screen, even when it appears nowhere in the title.
Use this mode to research offers, objections and pain points in your niche. Type the problem your product solves, in the words a customer would use, and see how competitors frame it.
Search by visuals: what happens on screen
Visual search uses the AI description of each ad's footage. Describe a scene, such as "person unboxing a package", "split screen before and after" or "founder talking to camera", and you get ads built around that visual idea.
This mode is the best way to research formats. If you are considering a UGC-style testimonial or a product demo, visual search shows you how others in your category executed it.
Filter by country
The country filter narrows results to ads shown in a specific market. Use it to focus on the market you sell in, and use it again later to understand where a competitor is testing and where it is scaling. We cover how to read country lists in detail below.
Combine modes for precise results
The strongest searches mix modes. For example: content search for "free shipping", country filter set to your main market, then scan the results for a visual style that fits your brand. Three filters turn thousands of ads into a shortlist you can actually review.
What you see in the search results grid
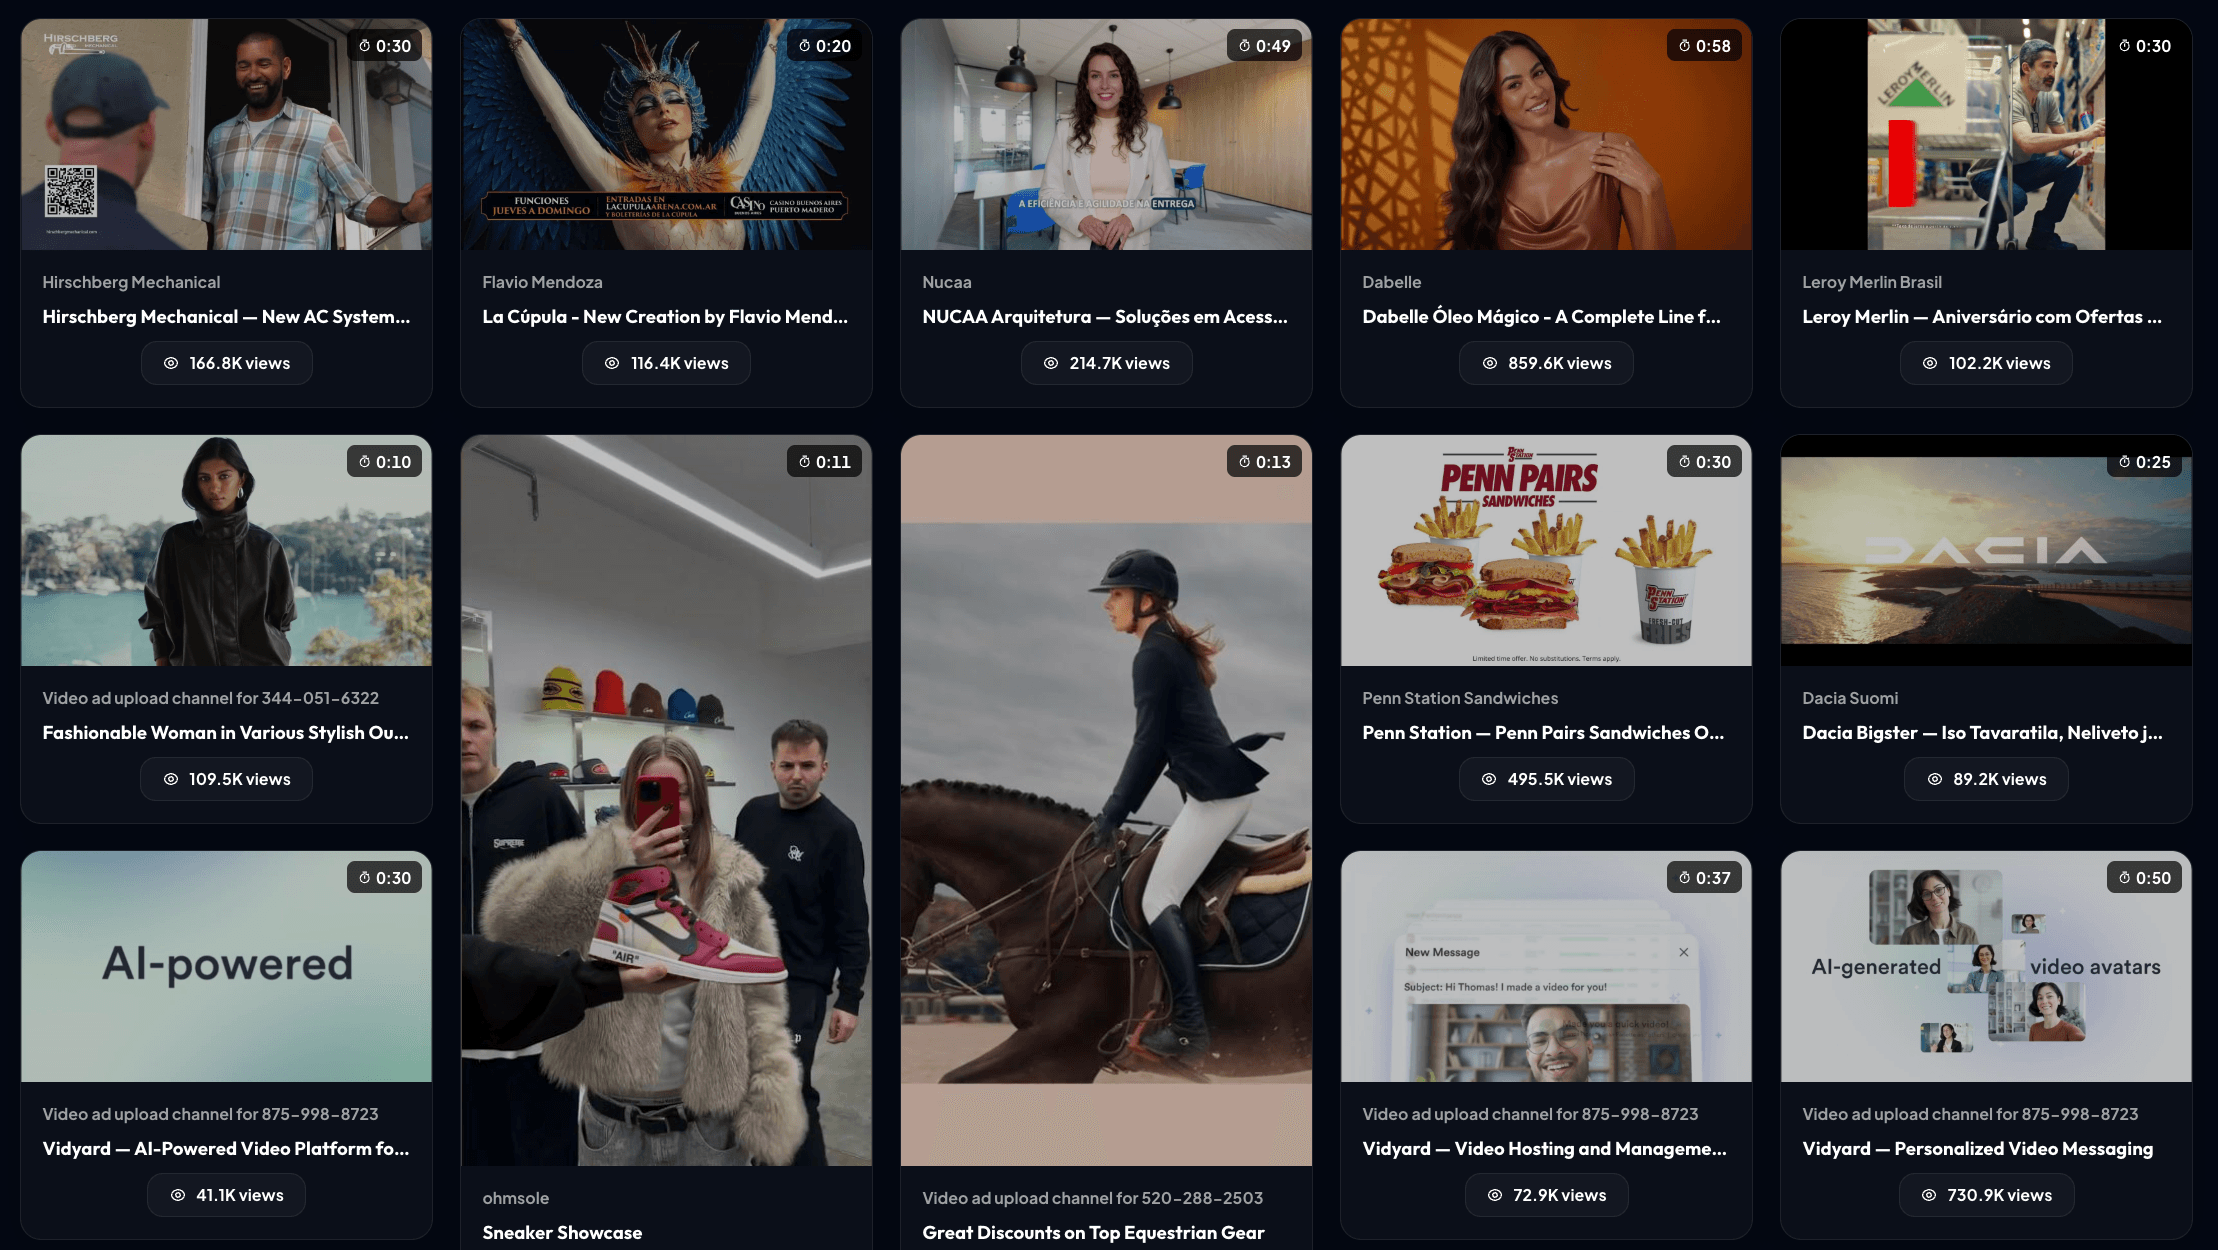
The AdSee AI search results grid shows each ad as a card with one frame from the video and its view count, and that is intentionally only the starting point. Views tell you an ad was seen. They do not tell you whether it was liked, how much it cost, whether it is still running, or where.
A beginner's most common mistake is picking the ad with the biggest number in the grid and stopping there. A high view count can come from a large budget pushed through unskippable placements, and those views may carry almost no attention.
So treat the grid as a filter, not a verdict. Pick the ten to twenty cards that look relevant, then click into each one.
Note that the library does not currently sort by spend or by how long an ad has been running. You evaluate those signals manually inside each card, which is exactly what the next sections teach you to do.
How to read an AdSee AI ad card: the metrics that reveal effective YouTube ads
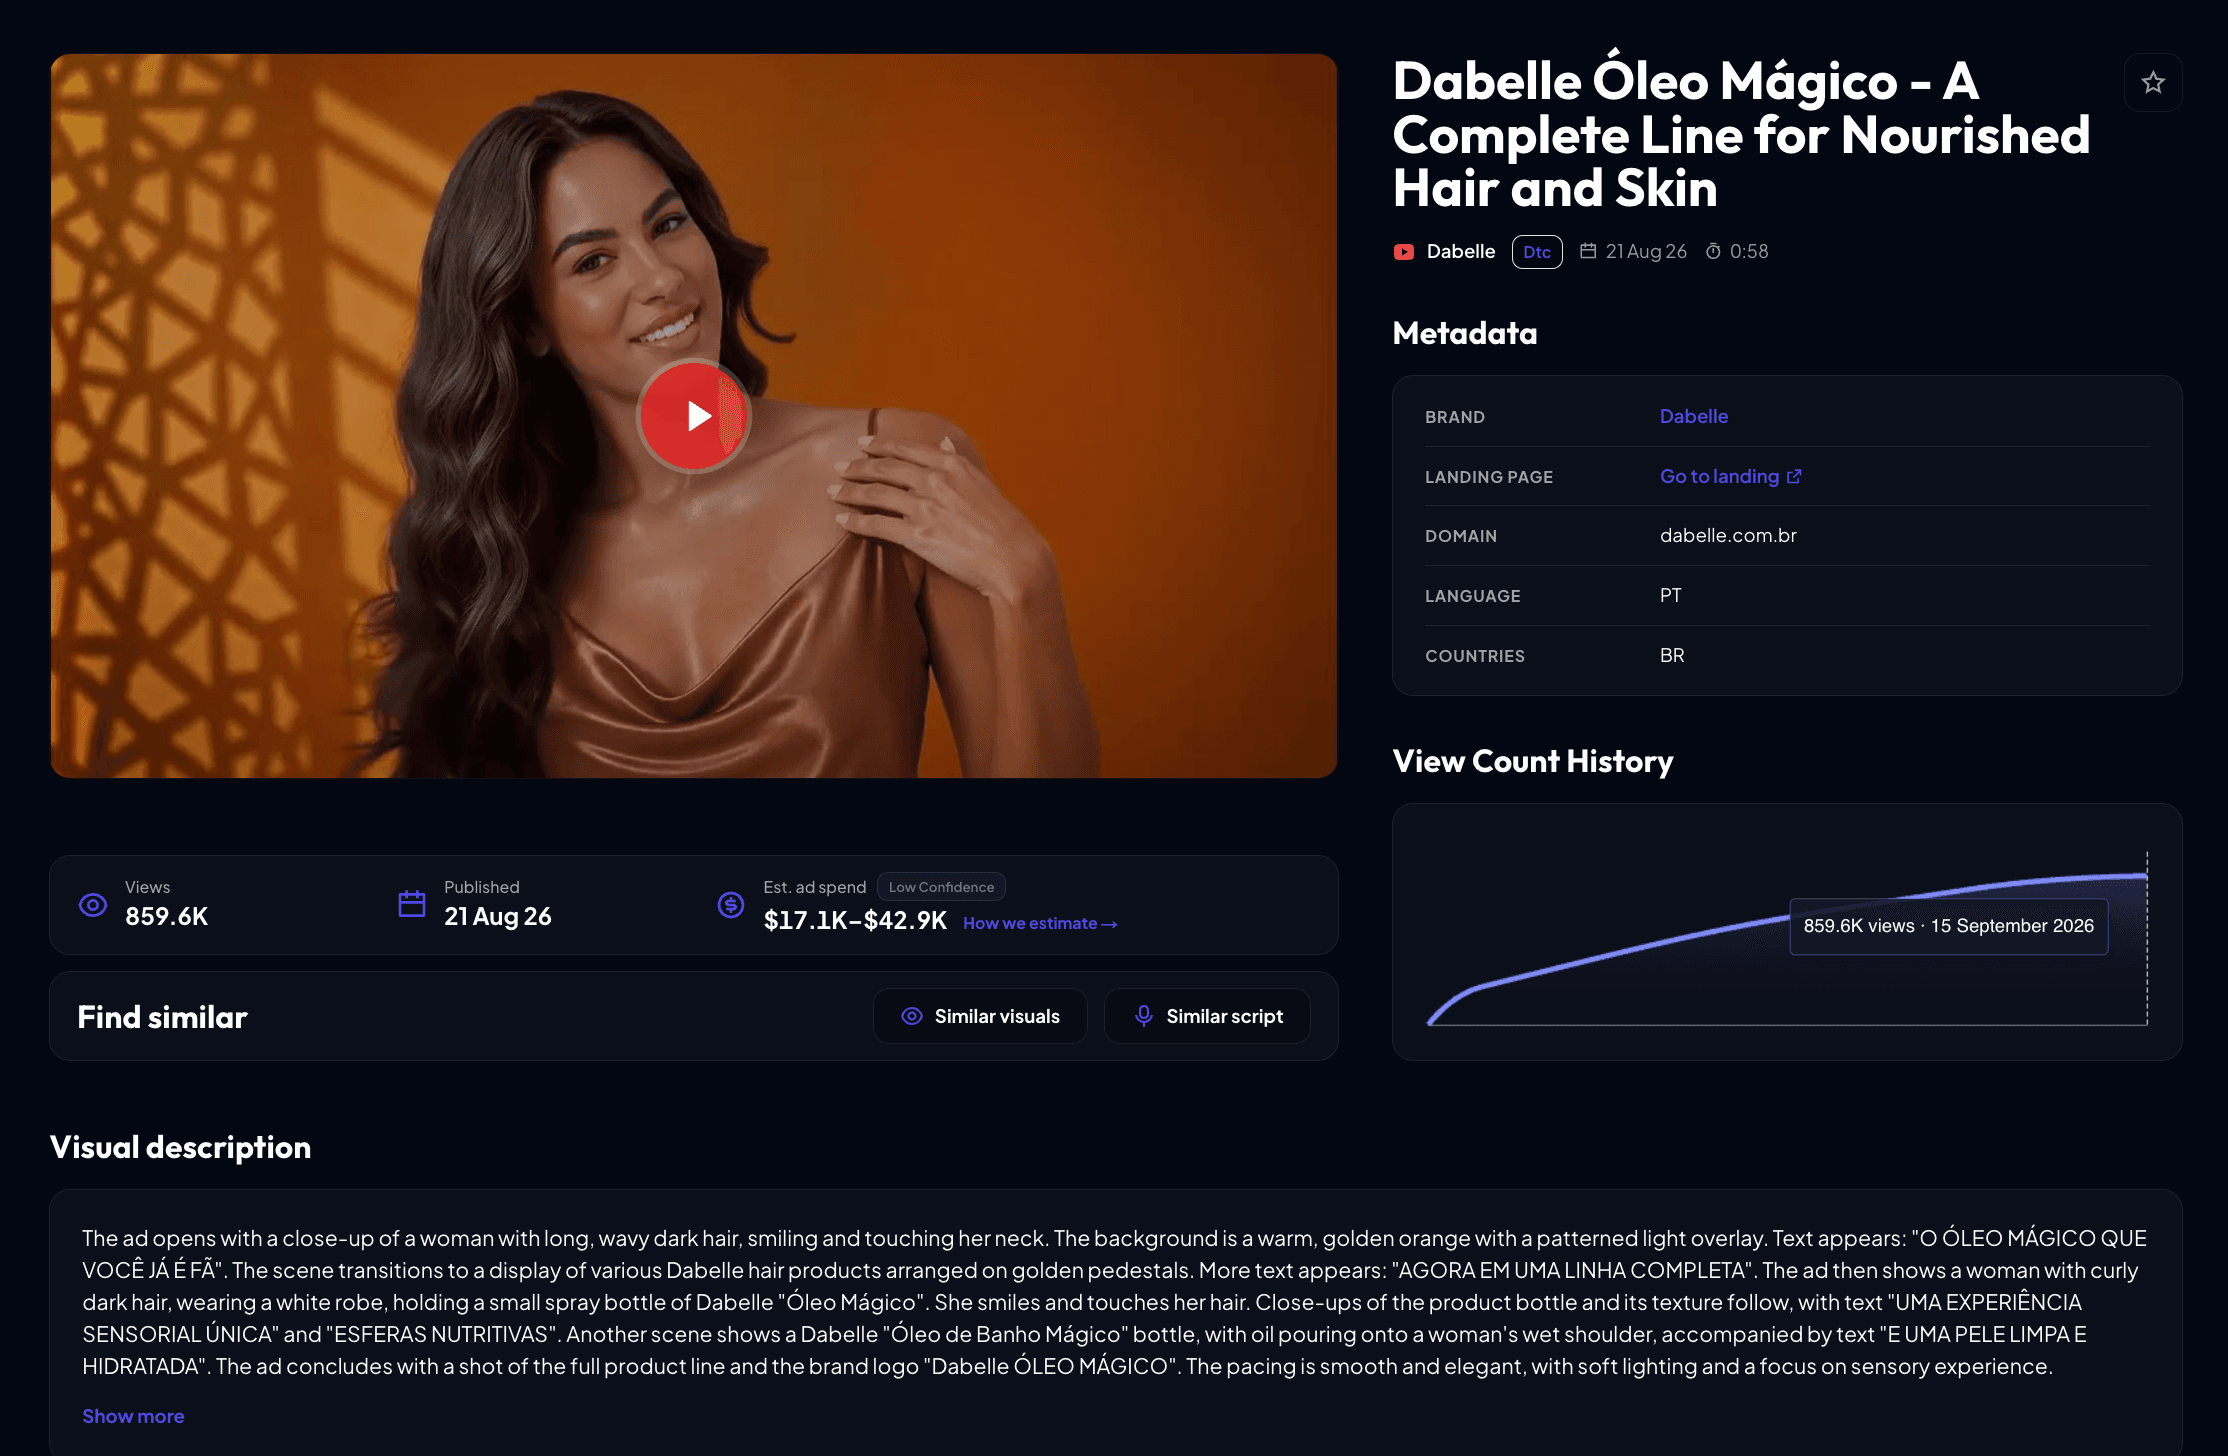
An AdSee AI ad card shows the ad's views, likes, estimated spend, launch date, view growth chart, country list and AI-extracted creative details, and reading them together is what separates a genuinely effective YouTube ad from one that was merely expensive. Open a card and you will see all of them on one page.
Here is what each metric means and why it matters.
Like-to-view ratio: did people choose to watch?
The like-to-view ratio divides views by likes, and it works as a public lie detector for a creative. On YouTube, people like content they chose to watch and enjoyed. They rarely like an ad that interrupted their video.
In the data we analyze at AdSee AI, content-level engagement looks like roughly one like for every 80 to 400 views. That range usually means viewers found the ad in discovery placements, recognized a creator, or simply watched it as content. At the other extreme, ratios near one like per 100,000 views or more point to forced in-stream reach, where the audience saw the ad because it played before something else.
How to calculate it: divide the view count by the like count. For example, a hypothetical ad with 2M views and 10K likes has one like per 200 views.
Neither result is automatically "bad". Forced reach can still sell. But if your definition of success is engagement, a strong ratio is the fastest way to find ads that people actually enjoy. Keep in mind that some advertisers hide like counts, so a missing number is not the same as zero.
Estimated spend: how much the competitor invested
AdSee AI shows an estimated spend for each ad as a range, calculated from the ad's views and typical cost-per-view levels in the markets where it ran. Treat it as an order of magnitude, never an invoice.
Spend is one of the strongest signals of a working ad, because money follows results. Advertisers rarely keep investing in creatives that fail. When a competitor has put a large and growing budget behind one video, that video has passed their internal tests.
Read the range honestly. If an ad ran mostly in cheaper markets, the real figure is likely closer to the bottom of the range. If it ran mostly in expensive markets such as the United States, it is likely closer to the top.
Cost per view: how efficiently the budget bought attention
Cost per view is the estimated spend divided by the number of views, and it tells you how efficiently an ad converted money into attention. You calculate it yourself from two numbers on the card.
For orientation, AdSee AI uses a US anchor benchmark of roughly $0.02 to $0.05 per view when estimating spend. Google explains that under cost-per-view bidding advertisers pay when a viewer watches or interacts with a video ad, so the real price depends on format, targeting and competition.
Why this matters: two hypothetical ads with 5M views each can be very different investments. If one reached those views with a much smaller estimated budget, its creative was doing more of the work. Low cost per view often means the ad holds attention, which the platform rewards with cheaper delivery. If your definition of success is cheap attention, this is your primary metric.
One caveat: cost per view drops naturally in cheap markets. Always compare ads that ran in similar countries, or you will mistake geography for creative quality.
View growth chart: is the ad still being scaled?
The view growth chart shows how an ad's views accumulated over time, and its shape tells you whether the advertiser is still investing in the creative. Views on an ad do not grow by themselves. They grow when someone pays for delivery.
Learn to recognize four shapes:
- Steady, steep growth. The ad is being actively funded right now. This is a live winner.
- A sharp spike, then a flat line. A short burst of budget, then the advertiser stopped. It may have been a test that failed, or a launch campaign that ended on schedule.
- Steps. Growth, a pause, then growth again. The advertiser keeps returning to the ad for new flights. That is a strong vote of confidence.
- Slow, continuous growth over many months. An evergreen creative with a steady budget. These are often the most valuable ads to study, because they have survived long enough to prove themselves.
Combine the chart with spend. Divide the spend estimate across the period in which views grew, and you get a rough picture of how much the competitor invested per month. Spend concentrated in a few days reads very differently from the same total spread across half a year.
Launch date: how long has the ad survived?
The launch date tells you the age of the ad, and age combined with ongoing view growth is the simplest proof that a creative works. An ad that was published eight months ago and still gains views has outlived dozens of weaker versions.
Creative fatigue is a known problem in performance marketing. Industry reporting such as the Business of Apps mobile gaming marketing report discusses how quickly advertisers in competitive categories have to refresh creatives. Against that background, long-lived ads stand out.
A very new ad is harder to judge. It may be a test with no verdict yet. Bookmark it and check the growth chart again in two to four weeks.
How to read countries: test ad or proven winner
The country list on an AdSee AI ad card reveals where a creative sits in its lifecycle, from a cheap test to a scaled campaign, and it is one of the most underrated signals when you look for the best YouTube ad examples. The same video means something very different when it runs in two markets than when it runs in forty.
Test markets: cheap countries, small budgets
Many advertisers test new creatives in markets where views are inexpensive, such as Brazil or Argentina, before spending in their core markets. A test there costs a fraction of what it would cost in the United States or Western Europe, and it still produces a real signal about whether the hook holds attention. This is the same logic as A/B testing: expose variants to a real audience, keep the winner, drop the rest.
So if an ad runs only in one or two low-cost markets and the advertiser's main customers are elsewhere, you are probably looking at a test. It is interesting, but not yet proven.
Home market: when one country is the whole strategy
The exception is when the cheap market is the advertiser's real market. A brand whose core business is in Brazil will run its ads only in Brazil because that is where its customers are. Palmolive, for example, can run a creative for Brazil only, because that ad is built for that market.
Before you label an ad a test, check where the brand actually sells. A single-country ad in the brand's home market is not a test; it is the main campaign.
Rollout and global scale
When an ad appears in a regional cluster, for example several countries in one region, the advertiser has usually moved past testing and is rolling the creative out. When it appears in dozens of countries at once, it has become a global asset. Both stages mean the creative passed its tests.
A practical rule: the more expensive and important the markets in the list, and the more of them there are, the stronger the evidence that the ad works.
Use the country filter to watch the lifecycle
Search your niche with the country filter set to known test markets, and you will see what competitors are experimenting with before it reaches your market. Then check back later. If a test ad appears in your main market with a growing view curve, you have watched a winner being chosen.
Putting it together: a checklist to spy on YouTube ads in your niche
A proven YouTube ad in AdSee AI usually shows at least three of these signals together: consistent view growth, significant estimated spend, a healthy like-to-view ratio or low cost per view, a launch date several months back, and presence in the advertiser's key markets. No single metric is enough. The combination is what separates a winner from noise.
Use this sequence each time you research a niche or a competitor:
- Define success: reach, cheap attention, engagement, or longevity.
- Search using content, visual and title modes, with the country filter set to your market.
- Scan the grid and pick the 10 to 20 most relevant cards. Do not judge by views alone.
- Open each card and note views, likes, spend range, launch date, growth shape and countries.
- Calculate the like-to-view ratio and cost per view.
- Classify each ad: test, rollout or proven winner.
- Shortlist the three to five ads that best match your definition of success.
A simple spreadsheet with one row per ad and one column per metric makes the comparison fast. Over time, it becomes your own map of what works in your category.
Tracking competitors over time
A one-off search shows a snapshot. Used regularly as a YouTube ad tracker, AdSee AI shows movement: which new creatives a competitor launched, which ones got more budget and which ones stopped growing. Repeating the same search every week or month is often more revealing than any single deep dive.
How to turn the best YouTube ad examples into your own script
AdSee AI extracts the hook, the call to action, the tone, the script and a description of each ad's visuals, and you can copy these elements to generate a new script adapted to your brand and niche. This is where research turns into production.
What to copy from the card
Copy these four elements from each shortlisted ad:
- The hook: what happens in the first seconds to stop the viewer.
- The main description: the structure of the ad, scene by scene.
- The call to action: what the viewer is asked to do, and how.
- The tone: humorous, urgent, calm, expert, and so on.
Adapt, don't clone
The goal is to copy the mechanism, not the ad. A competitor's exact words, footage and characters belong to them, and a cloned ad also fails in practice: viewers who have already seen the original will scroll past the copy. What transfers safely is the structure that made it work.
You can paste the extracted elements into an AI assistant with a prompt like this:
Test like your competitors do
Once you have a script, test it the same way the winners were tested: several hook variations, a modest budget, and a clear metric you defined at step zero. The goal of research is not to skip testing. It is to start testing from ideas that already worked for someone.
Why the first seconds of effective YouTube ads deserve extra attention
The hook decides whether a skippable YouTube ad gets watched at all, which is why AdSee AI extracts it as a separate field on every card. On skippable formats, the viewer can leave after a few seconds, so everything that follows depends on the opening.
Google's own creative guidance makes the point bluntly. Its Create with Google guide to skippable in-stream ads argues that "people don't hate ads, they hate bad ads." Research points the same way: a 2025 study in the Journal of Advertising Research examined how viewers perceive the intrusiveness of skippable and non-skippable YouTube formats, a reminder that format and creative quality shape how an ad is received.
When you compare hooks across your shortlist, look for patterns: a question, a bold claim, a visual surprise, a familiar problem. If several proven ads in your niche open the same way, that pattern is worth testing first. Google's Media Lab has also published experiments on video ad creative that are worth reading alongside your own findings.
Limitations: when the data can mislead you
AdSee AI data shows what was shown and how it was received publicly, but it cannot show conversions, revenue or return on ad spend, so every "best ad" you find is best by visible signals only. Keep these limits in mind.
Spend is an estimate
Spend ranges are calculated from views and typical market prices. Actual prices vary with bidding, targeting, format and season. Use the range to compare ads, not to predict a competitor's invoice.
Views are counted at a moment in time
View counters change. A card shows the number at the moment of the snapshot, and a growing ad will show more tomorrow. When you compare ads, compare them on the same day where possible.
Long-running does not always mean profitable
Most long-running ads are profitable, but not all. Sometimes a campaign simply keeps running because nobody switched it off, or a large brand buys reach for awareness with no direct return in mind. Check the growth curve: a truly funded ad keeps climbing.
Low like counts are not always bad
Brand awareness campaigns in in-stream placements naturally collect few likes. If your goal is reach, a weak like-to-view ratio does not disqualify an ad.
Small ads carry little signal
Ads with only a few thousand views have too little data to judge. Treat them as ideas, not evidence.
Your niche may differ from theirs
An ad that works for a competitor with a different price point, audience or market may not work for you. Research narrows your options; testing makes the decision.
Frequently asked questions about the best YouTube ad examples
These are the questions marketers ask most often when they start looking for the best YouTube ad examples with AdSee AI, answered in short, self-contained form.
What are the best YouTube ad examples to learn from?
The best YouTube ad examples to learn from are ads in your own niche that competitors keep funding. In the AdSee AI YouTube ads library, look for ads with steady view growth, significant estimated spend, several months of runtime and presence in key markets. These signals show an ad passed real tests, which matters more than fame or production quality.
How do I find my competitors' YouTube ads?
You can find competitor YouTube ads by searching AdSee AI by brand name, by phrases they use in their ads, or by visual style, then filtering by country. AdSee AI indexes titles, descriptions, spoken words and on-screen text, so you can spy on YouTube ads even when their titles are empty. Repeat the search regularly to track new creatives.
How can I tell if a YouTube ad is actually working?
A working YouTube ad usually shows several signals at once in AdSee AI: views that keep growing, a meaningful estimated spend, a launch date months back, and delivery in the advertiser's main markets. Add the like-to-view ratio or cost per view depending on your goal. No single number proves performance, but the combination is a reliable indicator.
Are views a good measure of a successful YouTube ad?
Views alone are not a reliable measure of a successful YouTube ad. A high view count can come from a large budget pushed through unskippable placements. In AdSee AI, compare views with likes, estimated spend and the view growth chart. An ad with fewer views but a low cost per view or strong engagement may be the better example to study.
What is a good like-to-view ratio for a YouTube ad?
In data analyzed by AdSee AI, ads people chose to watch typically collect about one like per 80 to 400 views. Ratios near one like per 100,000 views or more usually indicate forced in-stream reach. Neither is automatically good or bad; the right benchmark depends on whether your goal is engagement or pure reach.
How can I tell if a competitor's YouTube ad is a test?
A YouTube ad is likely a test when AdSee AI shows it running in one or two inexpensive markets, such as Brazil or Argentina, that are not the advertiser's main market, often with a short view spike. If those countries are the brand's home market, it is the main campaign. Ads that expand into more and pricier countries have passed testing.
How much do competitors spend on YouTube ads?
AdSee AI estimates each ad's spend as a range based on its views and typical cost-per-view levels in the countries where it ran. The estimate is an order of magnitude, not an exact figure. Ads shown mostly in cheaper markets tend to sit near the bottom of the range, while ads in expensive markets like the US sit higher.
Should I copy a competitor's best YouTube ad?
Not directly. Copying a competitor's ad word for word risks legal problems and usually underperforms, because viewers have already seen the original. Instead, use AdSee AI to extract the hook, structure, call to action and tone, then write an original script for your brand. Copy the mechanism, keep your own product, offer and voice, and test several hook variations.
Data and sources
Ad-level data (views, likes, spend estimates, launch dates, view growth, countries, AI creative breakdowns): AdSee AI YouTube ads library. Spend estimates use a US anchor benchmark of roughly $0.02–0.05 per view and are shown as ranges. Like-to-view reference ranges are based on ads analyzed by AdSee AI.
External sources: Google Ads Help on cost-per-view bidding; Create with Google, skippable in-stream ad guidelines; Journal of Advertising Research (2025); Think with Google, video ad creative experiments; Business of Apps, mobile gaming marketing trends 2026; Wikipedia, A/B testing.